OnAfterJobEnd Event section
Used to define procedural code that is to be executed after the data source connections are closed. For example, code to create tables or call the
ShellExecute function to open a report file.
Provided you have specified an input metadata source, the Job object is available in the OnAfterJobEnd Event section as an intrinsic variable called
dmgrJob. You can use the Job object to access all of the other objects to which it gives access (with the exception of the Questions collection). For more information, see
Using objects in the Event sections.
You can use the
CreateObject function to access other objects in this section.
If you have UNICOM Intelligence Reporter and want to script tables in a DMS file, you typically include the code in the OnAfterJobEnd Event section. For more information, see
Table scripting in a data management script.
Examples
1. Creating tables in Excel
This example uses ADO to access the case data in the output data source and advanced SQL queries to set up some tables in Excel. Note each table is created on a separate worksheet. For more information, see Advanced SQL Queries in the UNICOM Intelligence Developer Documentation Library.
Event(OnAfterJobEnd, "Create tables")
Dim ConnectionString, sqlQuery, adoConnection, adoRS, i
Dim xlApp, xlWorkbook, xlWorksheet
ConnectionString = "Provider=mrOleDB.Provider.2; Initial Catalog=C:\Program Files\IBM\SPSS\DataCollection\7\DDL\Output\
MSExcelTables.mdd; MR Init Category Names=1"
Set adoConnection = CreateObject("ADODB.Connection")
adoConnection.Open(ConnectionString)
Set xlApp = CreateObject("Excel.Application")
xlApp.Visible = true
Set xlWorkbook = xlApp.Workbooks.Add()
' Table of age by gender
Set xlWorksheet = xlWorkbook.Worksheets[1]
sqlQuery = "SELECT groupby.col[0] AS Age, SUM(gender = {male}) AS Male, SUM(gender = {female}) AS Female FROM vdata GROUP BY
age ON age.DefinedCategories() WITH (BaseSummaryRow)"
Set adoRS = adoConnection.Execute(sqlQuery)
DisplayTable(adoRS, xlWorksheet)
' Table of interest by gender
If xlWorkbook.Worksheets.Count > 1 Then
Set xlWorksheet = xlWorkbook.Worksheets[2]
Else
Set xlWorksheet = xlWorkbook.Worksheets.Add(, xlWorkbook.Worksheets[1])
End If
sqlQuery = "SELECT groupby.col[0] AS Interest, SUM(gender = {male}) AS Male, SUM(gender = {female}) AS Female FROM vdata WHERE
interest IS NOT NULL GROUP BY interest ON interest.DefinedCategories() WITH (BaseSummaryRow)"
Set adoRS = adoConnection.Execute(sqlQuery)
DisplayTable(adoRS, xlWorksheet)
' Visits summary data
If xlWorkbook.Worksheets.Count > 2 Then
Set xlWorksheet = xlWorkbook.Worksheets[3]
Else
Set xlWorksheet = xlWorkbook.Worksheets.Add(, xlWorkbook.Worksheets[2])
End If
sqlQuery = "SELECT SUM(visits) AS TotalVisits, AVG(visits) AS AverageVisits, MIN(visits) AS MinimumVisits, MAX(visits) AS
MaximumVisits FROM vdata WHERE visits > 0"
Set adoRS = adoConnection.Execute(sqlQuery)
DisplayTable(adoRS, xlWorksheet)
xlWorkBook.SaveAs("C:\Program Files\IBM\SPSS\DataCollection\7\DDL\Output\MSExcelTables.xls")
adoConnection.Close()
Sub DisplayTable(RecordSet, WorkSheet)
Dim xlStartRow, xlStartColumn, xlCol, xlRow, i
xlStartRow = 1
xlStartColumn = 1
xlCol = xlStartColumn
xlRow = xlStartRow
Dim xlCell
For i = 0 to (RecordSet.Fields.Count - 1)
Set xlCell = WorkSheet.Cells[xlRow][xlCol]
xlCell.FormulaR1C1 = RecordSet.Fields[i].Name
xlCol = xlCol + 1
Next
If Not RecordSet.EOF Then
xlRow = xlStartRow + 1
Do Until RecordSet.EOF
xlCol = xlStartColumn
For i = 0 to (RecordSet.Fields.Count - 1)
WorkSheet.Cells[xlRow][xlCol].FormulaR1C1 = RecordSet[RecordSet.Fields[i].Name]
xlCol = xlCol + 1
Next
xlRow = xlRow + 1
RecordSet.MoveNext()
Loop
End If
End Sub
End Event
Note This example is provided as a sample DMS file (called
MSExcelTables.dms) that is installed with the UNICOM Intelligence Developer Documentation Library. For similar examples that create charts in Excel and top line tables in Word, see the
MSExcelCharts.dms and
MSWordToplines.dms sample Include files. For more information, see
Sample DMS files that integrate with Microsoft Office.
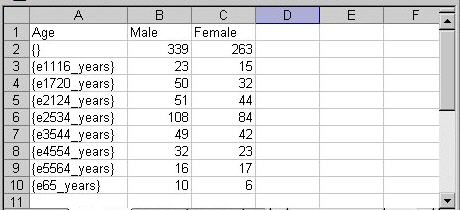
Here is the table on the first Excel worksheet:
2. Opening a report file
This example calls the
ShellExecute function to open the report file set up in the cleaning example in
Example 2: A complete example. (This example is provided as a sample DMS file called
Cleaning.dms. For more information, see
Sample DMS files.)
If you add the following code to the sample, the report file will open at the end of the job.
Event(OnAfterJobEnd, "Open report file")
ShellExecute("[INSTALL_FOLDER]\IBM\SPSS\DataCollection\7\DDL\
Output\Cleaning.txt")
End Event
See also

