Rim weighting formulae
Root mean square
The formula is given for a rim weighting matrix consisting of two variables (dimensions), but the same principle applies when there are more dimensions.
|
Notation
|
Represents
|
|
The target number in category i in the first dimension.
|
|
The sum of the observed numbers in category i in the first dimension.
|
|
The target number in category j in the second dimension.
|
|
The sum of the observed numbers in category j in the second dimension.
|
|
The number of categories in the first dimension.
|
|
The number of categories in the second dimension.
|
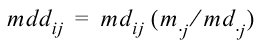
The formula for the weight adjustment is
Where
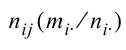
| Represents the weight adjustment calculated in the previous iteration for the cell at the intersection of category i in the first dimension and category j in the second dimension. In the first iteration, it is substituted with |
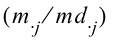
| Represents the sum of the weight adjustments calculated in the previous iteration for category j in the second dimension. In the first iteration, the expression is substituted with 1. |
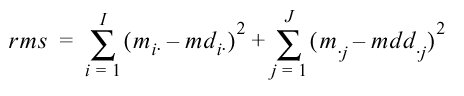
The calculation for the root mean square is
Where
| Represents the sum of the weight adjustments calculated in the previous iteration for category i in the first dimension. |
| Represents the sum of the weight adjustments calculated in the current iteration for category j in the second dimension. |
At the end of each iteration, the Weight component compares the root mean square with the product of the weighted total and the given limit. (The limit defaults to 0.005, but it can be set to another proportion.) The iterations continue until all of the weights are within the limit or the maximum number of iterations has been reached.
Rim weighting efficiency
The rim weighting efficiency figure gives an indication of how well balanced the sample is.
Let
| Be the preweight for case j |
| Be the rim weight for case j |
Then the rim weighting efficiency is
If the data for many respondents needs to be weighted heavily up or down, the efficiency percentage will be low. The greater the percentage the more well balanced the sample.
Further information
For further information on rim weighting see the Rim Weighting Theoretical Basis Paper entitled “ON A LEAST SQUARES ADJUSTMENT OF A SAMPLED FREQUENCY TABLE WHEN THE EXPECTED MARGINAL TOTALS ARE KNOWN”, by W. Edwards Deming and Frederick F. Stephan, in Volume 11, 1940 of the Annals of Mathematical Statistics.
See also