Tabulation Services Component Object Model Reference
The Tabulation Services component is used for creating a derived variable based on a given axis expression. You can modify a variable by setting the axis expression in UNICOM Intelligence Reporter, but this does not affect the source variable. If the source variable is a numeric variable, it will still be still a numeric variable after applying an axis expression. You may occasionally want to create a categorical variable that is based on the axis expression modification. You can then use that derived variable to create tables.
The Tabulation Services component is designed for this purpose. The following sample demonstrates how to use the component.
Sample script file: TabulationServices.mrs
This example script is based on the Museum sample data set. See
Running the sample table scripts for information on running the example scripts.
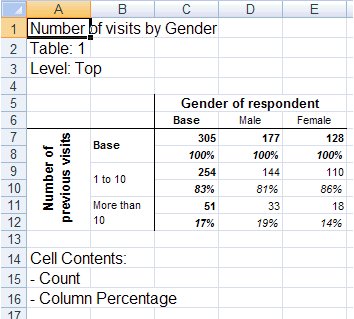
The script creates a derived variable based on the axis expression that bands the visits values into two categories. It also includes a special mean element.
Set TabulationServ = CreateObject("TabulationServices.AxisExpressionServices")
TabulationServ.CreateAxisVariable(TableDoc.DataSet.MDMDocument.Fields["visits"], _
"{visits1 '1 to 10' expression('visits > 0 And visits < 11'), _
visits2 'More than 10' expression('visits > 10'), _
mean 'Mean' mean(visits)}",_
"NewVisits", 0)
' Create the tables
With TableDoc.Tables
.AddNew("Table1", "NewVisits * gender", "Number of visits by Gender")
End With
' Populate the tables
TableDoc.Populate()
' Export the tables
With TableDoc.Exports.mrExcelExport
.Properties["Interactive"] = True
.Properties["LaunchApplication"] = True
.Properties["HideApplication"] = False
.Properties["UseExcelStyles"] = True
.Export(EXPORT_FILE)
End With
The resulting table after exportation to Excel:
See
See also