Defining statistical tests
Sample script file: StatisticalTests.mrs
You can define statistical tests to be run on your tables to show whether differences in the distribution of counts in tables are statistically significant or whether they are merely due to chance. Currently the following tests are available:
▪Chi-square test. This test looks at the variables on the side and top axes of a table and tests whether they are independent. For example, it can be used to show whether variations in political opinions depend on the respondent's age or not.
▪Cell chi-square test. This test looks at the variables on the side and top axes of a table and tests whether they are independent. For example, it can be used to show whether variations in political opinions depend on the respondent's age or not. Unlike the chi-square test, which is carried out on a whole set of rows and columns, the cell chi-square test is carried out independently on each table cell.
▪Column proportions test. This test looks at each row of a table independently and compares pairs of columns, testing whether the proportion of respondents in one column is significantly different from the proportion in the other column.
▪Column means test. This test looks at means that are presented in a row of a table and compares pairs of columns, testing whether the mean in one column is significantly different from the mean in the other column.
▪Fisher's exact test This test looks at the variables on the side and top axes of a table with two rows and two columns and tests. It is suitable for use in a subset of the tables for which the chi-square test is available.
▪Net difference test This test deals with each row independently and compares the proportions in four columns at a time to test whether the difference between the values in the first pair of columns is significantly different from the difference between the values in the second pair of columns. For example, when comparing columns A, B, C and D, the difference between A and B will be tested against the difference between C and D to see whether the difference between the two is significant.
▪Paired preference test. This test deals with each column independently and compares pairs of rows to see whether the figures in each pair differ significantly from one another.
▪T-test test. This test compares the means of two variables, computes the difference between the two variables for each case, and tests to see if the average difference is significantly different from zero.
▪Tukey test. This test uses the Studentized range statistic to make all pairwise comparisons between groups.
These tests are suitable only for specific types of tables. When run on unsuitable tables, the results can be misleading. For detailed information about the tests, the kinds of tables for which they are suitable, and the statistical formulae that are used, see
Statistical tests.
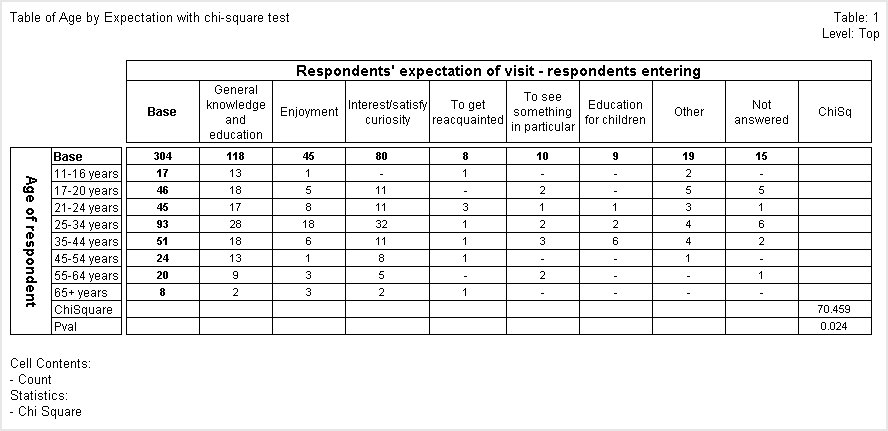
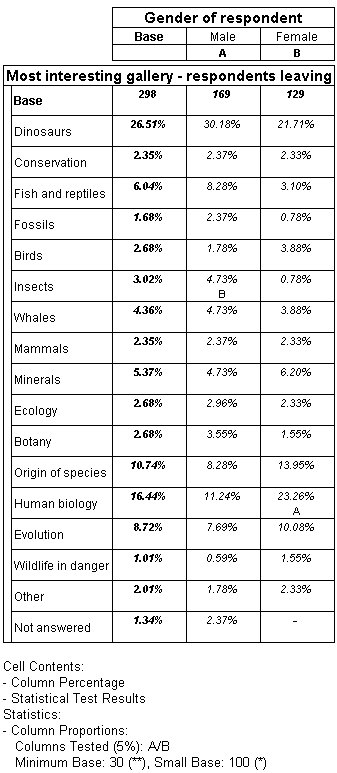
Table of age by expect with chi-square test and table of interest by gender with column proportions test
The following example creates two tables, one with the chi-square test and the other with the column proportions test. This example assumes that you have already created the table Document object and loaded the Museum sample data set as shown in
Creating a simple table of Age by Gender.
' Create 2 tables
With TableDoc.Tables
.AddNew("Table1", "age * expect", _
"Table of age by expectation with chi-square square test")
.AddNew("Table2", "interest * gender", _
"Table of interest rating by gender with column proportions test")
End With
' Remove the column percentages cell item and
' define the chi-square test on table 1
TableDoc.Table1.CellItems.Remove(1)
TableDoc.Table1.Statistics.Add("ChiSquare")
' Remove the counts cell item and
' define the column proportion test on table 2
TableDoc.Table2.CellItems.Remove(0)
TableDoc.Table2.Statistics.Add("ColumnProportions")
Here is the table with the chi-square test:
Here is the table with the column proportions test:
Requirements
UNICOM Intelligence Reporter
Next
See also


