Grid tables
Sample script file: GridTables.mrs
This example script is based on the Household sample data set. See
Running the sample table scripts for information on running the example scripts.
Creating a grid table shows an example of using the
Tables.AddNewGrid method to create a grid table. This topic provides more information about grid tables and how they work.
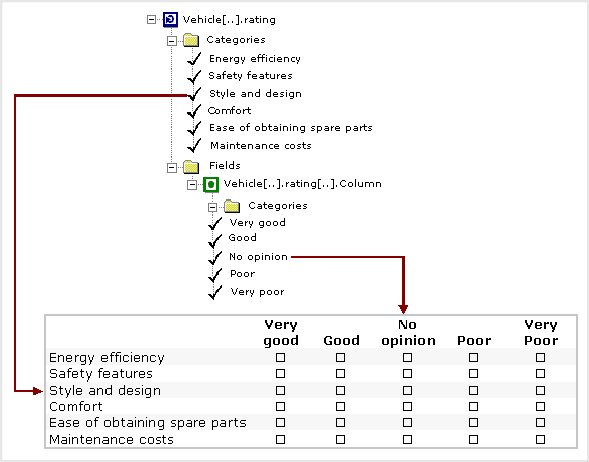
The Household sample has a grid question at the vehicle level that asks respondents to select a rating category for some of the vehicle's features. The full name of the grid question is vehicle[..].rating, which we can simplify to vehicle.rating in the specification. We will use this grid question as an example in this topic.
Grid questions can be considered categorical loops, which are loops in which a category list defines the iterations and the iterations are presented simultaneously in a grid-like format. The category list that defines the iterations is sometimes referred to as the controlling category list. One or more variables inside the loop define the question(s) that are to be asked for each iteration. The vehicle.rating grid contains one variable (called Column), which has a category list that defines the rating categories.
Vehicle.rating grid variable in the metadata and in the questionnaire
The following diagram shows a simplified representation of the internal structure of the loop in the metadata and how it relates to the grid question when it is presented in paper questionnaire:
In this diagram, each iteration of the loop forms a row of the grid question and we can see that the iterations correspond to the categories in the loop's controlling category list. The columns of the grid question are formed from the categories of the question inside the loop.
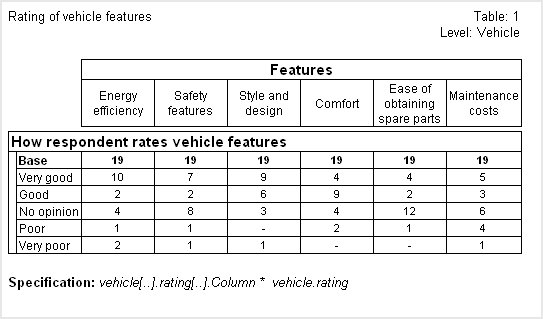
First we will use the Tables.AddNewGrid method to create a grid table for this grid question using the default options:
TableDoc.Tables.AddNewGrid("Table1", "vehicle.rating", , "Rating of vehicle features")
Notice that we have used the simplified form of the loop's full name. Here is the table:
In this table, the iterations are displayed as columns because this is how the loop's default orientation is defined in the metadata. We can override this by setting the third parameter of the Tables.AddNewGrid method to 1. This is equivalent to the DisplayOrientation.doRow constant, which specifies that the iterations are to be displayed as rows:
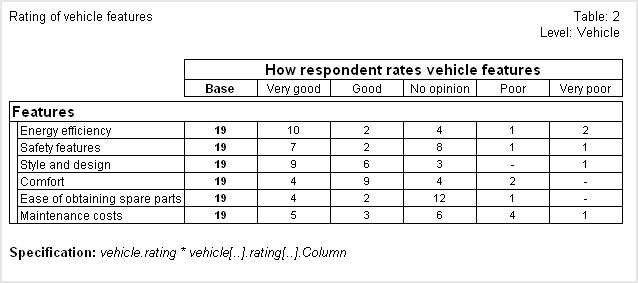
TableDoc.Tables.AddNewGrid("Table2", "vehicle.rating", 1, "Rating of vehicle features")
Here is the table with the iterations forming the rows:
Notice that an annotation has been used to display the table specification under each table. This shows the specification that you would need to use if you were to create the tables using the
Tables.AddNew method. This means we can create similar tables (see
The base in grid tables for details of how the base differs) like this:
TableDoc.Tables.AddNew("Table1", "vehicle.rating.column * vehicle.rating", "Rating of vehicle features")
TableDoc.Tables.AddNew("Table2", "vehicle.rating * vehicle.rating.column", "Rating of vehicle features")
When you use the Tables.AddNew method to create a grid table, there is no parameter to define the orientation, because the orientation is implied in the specification. The iterations are displayed in rows or columns according to whether you specify the loop as the side or top axis. In Table1, the loop is specified as the top axis and so the iterations will form the columns of the table. In Table2, the loop is specified as the side axis and so the iterations will form the rows of the table.
In this example we have also shortened the full name of the variable inside the grid. This is optional. It would work just as well if we specified the full name as vehicle[..].rating[..].column.
The vehicle.rating loop contains only the Column variable. However, some loops contain more than one variable. When you use the Tables.AddNewGrid method with a loop that contains more than one variable, all of the categorical variables that are contained in the loop are concatenated together in the grid table. Any non-categorical variables that are inside the loop are ignored.
This means that if you don't want to include all of the variables in the grid table, you need to use the Tables.AddNew method and specify the individual variables you do want to include. For example:
TableDoc.Tables.AddNew("MyTable", "MyLoop * MyLoop.Variable1 + MyLoop.Variable3")
You can create grid tables from any grid or loop that has at least one iteration. In MDM terms, this is any Grid or Array object that has at least one Element object. (The MDM creates the Element objects for a numeric loop automatically, provided that the loop is “bounded”; that is, that it has MinValue and MaxValue values specified in the metadata.)
However, creating grid tables from numeric loops is less common than for categorical loops. This is because generally the iterations in numeric loops don't have a fixed meaning as they do in categorical loops. For example, consider a numeric loop that asks questions about journeys to the supermarket in which each iteration represents one of the journeys. Creating a grid table to tabulate the questions in the loop by the iteration (which represents whether it was the first, second, or third journey, etc. in the week) generally makes little sense.
Restrictions
You cannot specify a subset of the iterations to be included.
See also