Professional > Table scripting > Statistical tests > Cell chi-square test > Statistical formula for the cell chi-square test
 
Statistical formula for the cell chi-square test
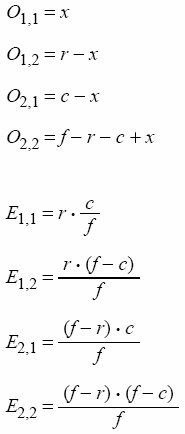
For each cell, a two-by-two contingency table is established, with the actual cell from the cross table as the upper left cell, and the other cells derived by all three possible negations of the cross table cell:
 
Total
Column
NOT column
Total
f
c
f-c
Row
r
x
r-x
NOT row
f-r
c-x
f-r-c+x
The two-by-two contingency table has one degree of freedom; the other three cells are determined when one of the four cells is known (x).
The following table shows the notation used in this topic.
Notation
Description
The observed values.
The expected values given the null hypothesis.
The first index points to the two-by-two table rows and the second index to the columns:
Null hypothesis
The deviation between the observed values O i,j and the expected values E i,j are not significant and are at random. That is the variables Row/NOT row and Column/NOT column are independent.
χ2 statistic
The null hypothesis is rejected if the p value for the χ2 statistic is smaller than the specified significance level. The p value is calculated from the chi-square distribution with 1 degree of freedom.
Yates' correction for small samples
In the underlying theoretical assumptions of the test there is an assumption of continuity that becomes dubious with very small samples and where some of the expected values are very small. In order to avoid a situation where rejection is done when assumptions of continuity are dubious the following correction is applied:
χ2 statistic with Yates' correction when at least one of the expected cell values
(E1,1, E1,2, E2,1, E2,2) < 5 :
The consequence of the correction may be that an uncorrected rejection is cancelled.
See also
Cell chi-square test