Examples of the column proportions test
Sample script file: ColumnProportionsTest.mrs
This example script is based on the Museum sample data set. See
Running the sample table scripts for information on running the example scripts.
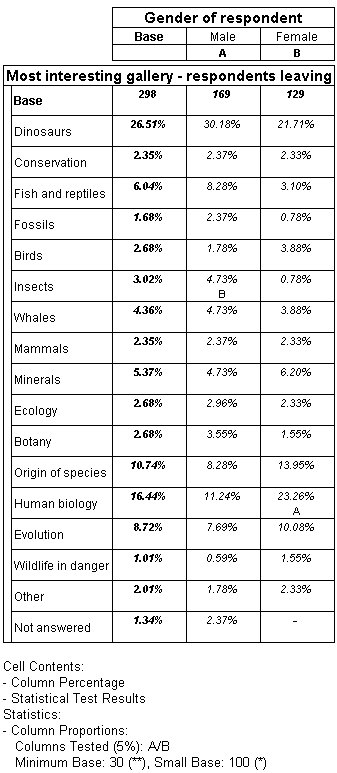
The first column proportions test in this example tests whether there are any significant differences in the proportions of male and female respondents who found the different galleries most interesting.
Notice that UNICOM Intelligence Professional has assigned IDs of A to the Male column and B to the Female column and that these are displayed below the column headings. Notice the B below the cell contents in the Male cell of the Insects row, and the A below the cell contents in the Female cell of the Human biology row. For the Insects row, this indicates that the proportion of male respondents is higher than the proportion of female respondents and that this difference in proportions is statistically significant at the 5% significance level. For the Human biology row, this indicates that the proportion of female respondents is higher than the proportion of male respondents and that this difference in proportions is statistically significant at the 5% significance level.
The column proportions test in this table shows us that, although the proportions of male and female respondents who found the different galleries most interesting vary, the differences are statistically significant only for the Insects and Human biology galleries. The differences in the preferences for all of the other galleries can be explained by chance.
See also
Adding a minimum p value to a table for an example of this table that displays only rows with significant results.
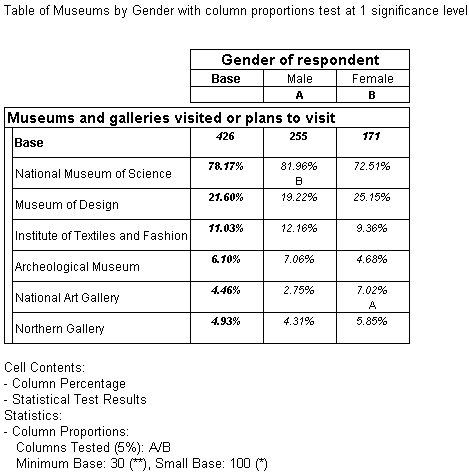
The next example tests whether there are any significant differences in the proportions of male and female respondents who visited or planned to visit other museums.
Notice that UNICOM Intelligence Professional has assigned IDs of A to the Male column and B to the Female column and that these are displayed below the column headings. Notice the B below the cell contents in the Male cell of the National Museum of Science row, and the A below the cell contents in the Female cell of the National Art Gallery row. For the National Museum of Science row, this indicates that the proportion of male respondents is higher than the proportion of female respondents and that this difference in proportions is statistically significant at the 5% significance level. For the National Art Gallery row, this indicates that the proportion of female respondents is higher than the proportion of male respondents and that this difference in proportions is statistically significant at the 5% significance level.
The column proportions test in this table shows us that, although the proportions of male and female respondents who found the different galleries most interesting vary, the differences are statistically significant only for National Museum of Science and National Art Gallery. The differences for all of the other named museums can be explained by chance.
Examples of testing different columns
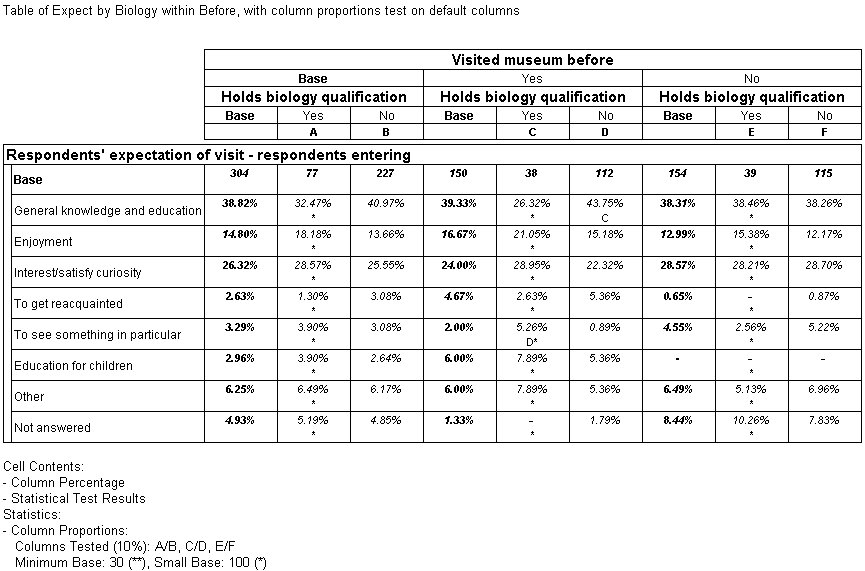
The next example shows the results of a column proportions test using the default columns, on a table with Biology nested within Before on the top axis:
This example tests the default selection of columns; that is, it tests all columns in each section of the table against each other. In this case, the test indicates whether there are any significant differences between the expectations of those who have a biology qualification and those who do not. The results show a significant difference in the expectation of general knowledge and education, between those with and without a qualification who have visited the museum before (columns C and D).
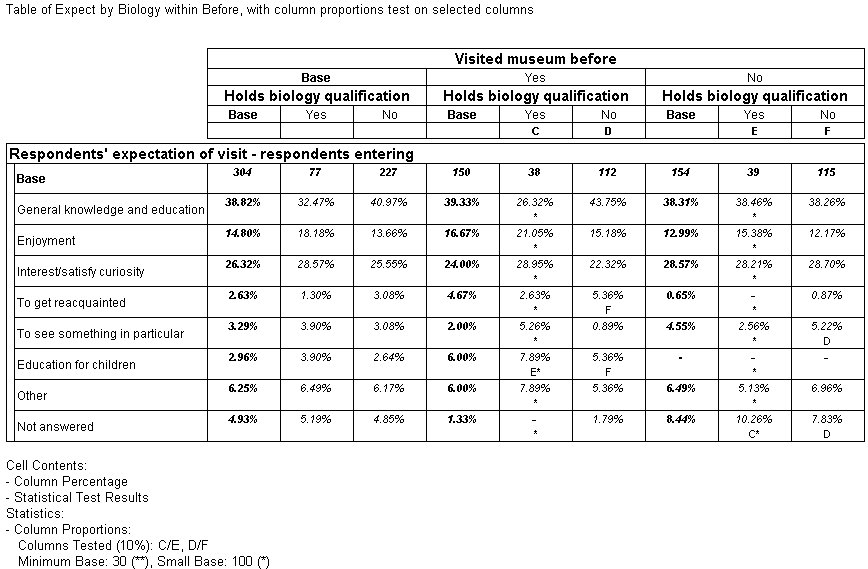
However, in this table, it is also possible that we might want to concentrate on significant differences between those who have been to the museum before and those who have not.
The following example tests this:
"C/E, D/F"
The following example tests this, using the script:
TableDoc.Table6.Statistics.TestColumns = "C/E, D/F"
The results show a significant difference in the expectation of education for children, between people with no biology qualification who have visited the museum before and those who have not (columns D and F).
See also