Displaying an effective base on a weighted table
Sample script file: ColumnProportionsTest.mrs
This example script is based on the Museum sample data set. See
Running the sample table scripts for information on running the example scripts.
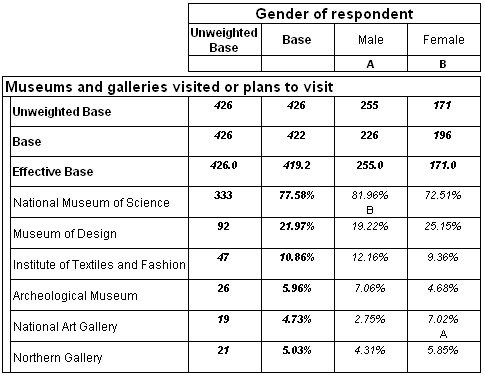
This example displays a table weighted by the genbalance weight variable. A column proportions test is applied and the effective base is displayed. Here is the script to display the table:
.AddNew("Table8", "museums{effectivebase(), ..Northern_Gallery} * gender", _
"Weighted Table of Museums by Gender with column proportions test")
TableDoc.Table8.Weight = "GenBalance"
TableDoc.Table8.Statistics.Add("ColumnProportions")
TableDoc.Table8.Statistics.ColumnProportions.SigLevel = 10
Here is the resulting table:
museums{effectivebase(),..Northern_Gallery}
This example displays a table weighted by the genbalance weight variable. A column proportions test is applied and the effective base is displayed. Here is the script to display the table:
.AddNew("Table8", "museums{effectivebase(), ..Northern_Gallery} * gender", _
"Weighted Table of Museums by Gender with column proportions test")
TableDoc.Table8.Weight = "GenBalance"
TableDoc.Table8.Statistics.Add("ColumnProportions")
TableDoc.Table8.Statistics.ColumnProportions.SigLevel = 10
Here is the resulting table:
See also