Specifying decimal places for summary statistic elements
Sample script file: DecimalPlacesOnSummaryElements.mrs
This example script is based on the Museum sample data set. See
Running the sample table scripts for more information.
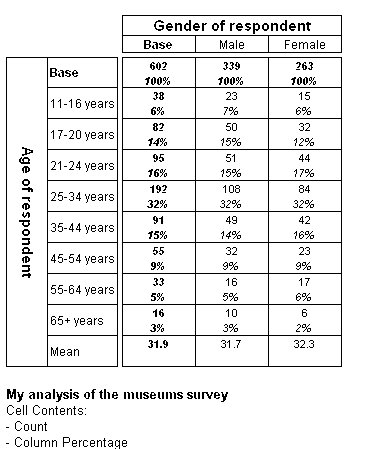
You can specify the number of decimal places to display for a summary statistic, using the Decimals property of the Element object. The following script creates a table with the mean age displayed to 1 decimal place:
Set Table = TableDoc.Tables.AddNew("Table01", "age{.., mean()} * gender", "Decimal places on elements")
Table.Side.Age.Elements["mean"].Decimals = 1
You can also use the axis expression syntax to specify decimals for a summary statistic, as shown in the following script:
Set Table = TableDoc.Tables.AddNew("Table02", "age{.., mean() [Decimals=1]} * gender", "Decimal places on elements")
This results in the following table:
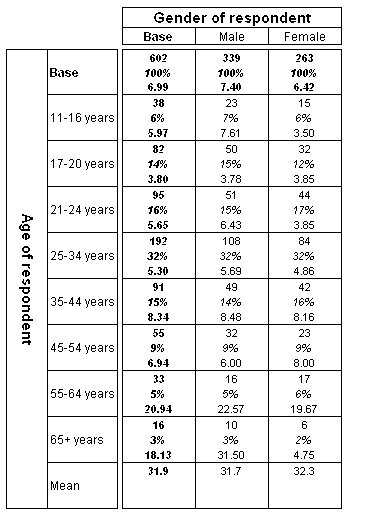
Note The Decimals property of the CellItems object is not affected by the Decimals property of the Elements object. You can use the two Decimals properties within the same table, as shown in the following example, which creates a table with mean age values displayed to 1 decimal place and mean visits values displayed to 2 decimal places:
Set Table = TableDoc.Tables.AddNew("Table03", "age{.., mean() [Decimals=1]} * gender", "Decimal places on elements")
Table.CellItems.AddNew(4, 2, "visits") ' 4 = itMean
This results in the following table:
See also


