Creating profile tables with hierarchical data
Sample script file: ProfileTables.mrs
This example script is based on the Household sample data set. See
Running the sample table scripts for more information.
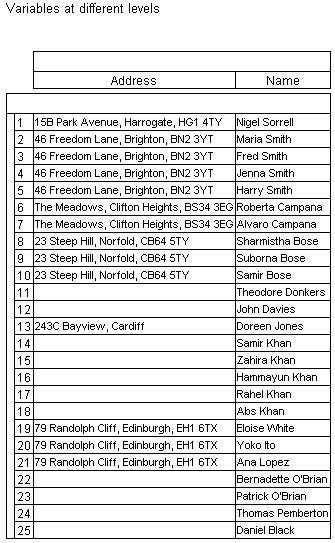
Profile results are displayed at the level of the lowest level variable included on the table. Respondent data from upper levels is down-leved to the lower level. For example, this table shows the address variable with the addition of the person.name variable:
Set Table = TableDoc.Tables.AddNewProfile("Table7",
"profile({address, person.name})", "Variables at different levels")
Profile table of address and name
Notice that the address column contains duplicate addresses in some of the rows, as the addresses are repeated for each person at that address.
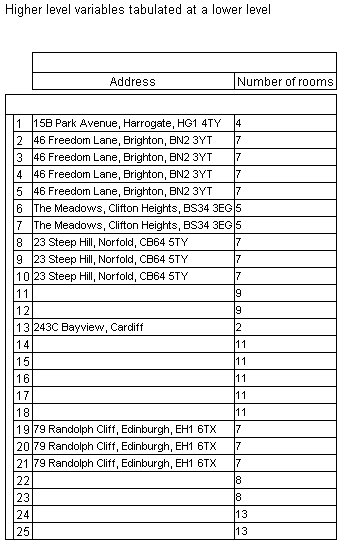
It is also possible to specify a lower level if all the variables are at a higher level; for example, you can create a table showing address and number of rooms, but display it at the person level:
Set Table = TableDoc.Tables.AddNewProfile("Table8", "profile({address, numrooms})",
"Higher level variables tabulated at a lower level")
Table.Level = "person"
The resulting table has duplicate values for some rows, as they are repeated for each person:
Profile table of address and numrooms tabulated at person level
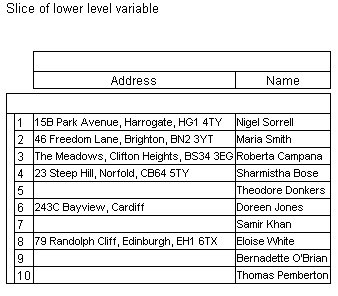
You can also tabulate a higher level variable with a slice of a lower level variable; for example, this script creates a table to show names and addresses for the first person in the household:
Set Table = TableDoc.Tables.AddNewProfile("Table9", "profile({address, person[1].name})",
"Slice of lower level variable")
Profile table of address and name of first person in household
See also


