Example
The PercentageOnElementsAsked.mrs sample script is based on the Short Drinks data set. It uses the IsElementInVersions function to define a unique base for each category in the sclass variable, reflecting the number of times the category was available as a possible answer to respondents who were asked the question about socioeconomic class. The script then uses this unique base to calculate percentages for the number of respondents whose answers fell into each category, compared to the number of respondents who were offered the category as a response.
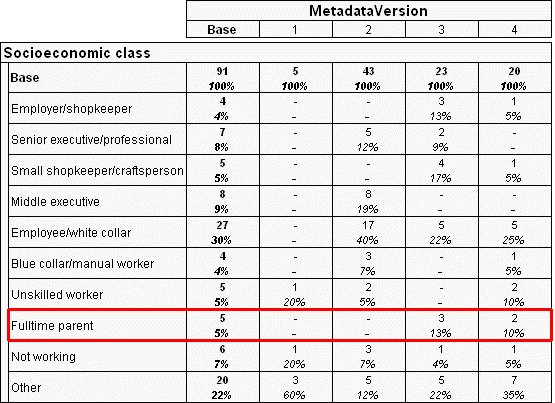
The script creates three tables, all with Socioeconomic Class on the side axis and Metadata Version on the top axis. In the first table, the percentages for each category are calculated using the number of respondents who were asked the question about socioeconomic class:
TableDoc.Tables.AddNew("Table01", _
"sclass * DataCollection.MetadataVersion", _
"The variable sclass tabulated as normal")
Table showing Socioeconomic class by Metadata version. Percentages are calculated based on number of respondents who were asked the question
Notice that the overall percentage across for the Fulltime Parent category is 5%. This figure represents the percentage for this category across all versions, including those in which it was not available.
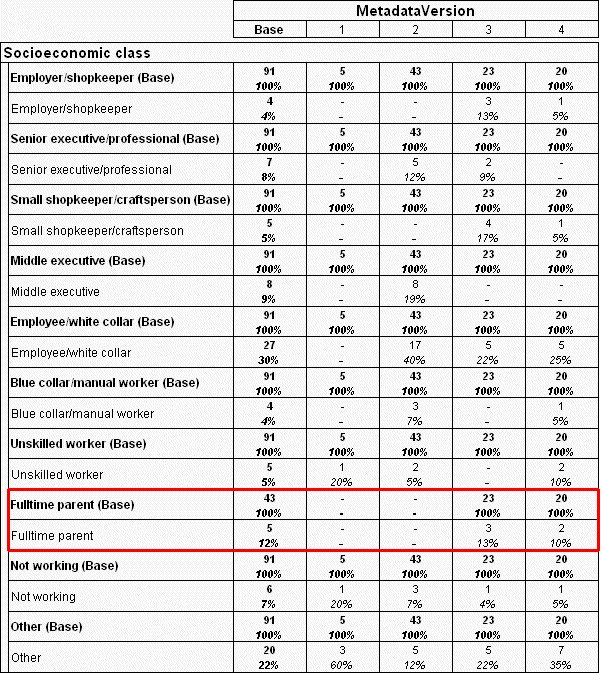
In the second table, an axis expression is used to add unique base elements associated with each category element. These bases show the number of times each sclass category was asked. The percentages for each category are then calculated using the number of respondents who were asked the particular category, rather than the entire question:
TableDoc.Tables.AddNew("Table02", _
CreateAxisSpec(TableDoc, "sclass", True, "") + " * DataCollection.MetadataVersion", _
"The variable sclass with individual element bases inserted and percentaged on")
Table showing Socioeconomic class by Metadata version. Percentages are calculated based on number of respondents who were offered the category as a response to the question
Notice that the overall percentage for the Fulltime Parent category is now 12%, representing the number of times the category was answered compared to the number of times it was available to be answered.
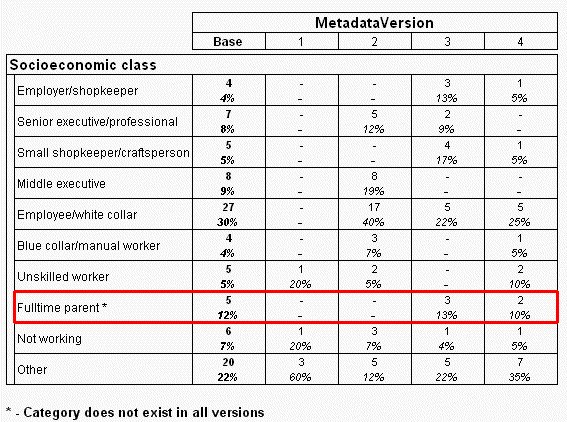
The third table uses a similar axis expression, but this time it prevents the new base elements from being displayed in the table, while still using them to calculate the percentages for each category:
Set Table = TableDoc.Tables.AddNew("Table03", _
CreateAxisSpec(TableDoc, "sclass", False, " *") + _
" * DataCollection.MetadataVersion", _
"The variable sclass with the individual element bases hidden")
An asterisk (*) is added to the label for any element that was not included in all the versions of the metadata that appear in the table. An annotation provides a key for this symbol in the table:
Table.Annotations[annTitleFooter].Specification = "* - Category does not exist in all versions"
Table showing Socioeconomic class by Metadata version. Percentages are calculated based on number of respondents who were offered the category as a response to the question. Bases are hidden.
The tables above show the results of running the script on versions 1-4 of the data. You can see the effect of running this script on different versions of the questionnaire by changing the MDD_VERSION constant at the start of the script.
' Const MDD_VERSION = "{..}" ' All versions of the metadata
Const MDD_VERSION = "{1..4}" ' sclass variable exists in versions 1 to 4
' Const MDD_VERSION = "{3,4}" ' "Fulltime Parent" category only exists in versions 3 and 4
See also