Creating your first table
This topic shows how to create a table of age by gender.
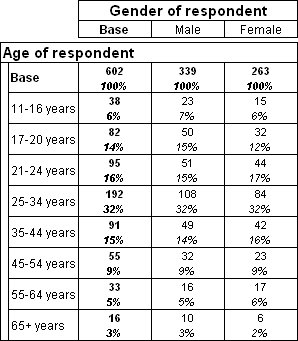
Table of age by gender
Each axis in this table is created from a single categorical variable (
age on the side and
gender on the top). Categorical variables have a limited number of distinct values or categories, and are typically based on questions that have a predefined set of answers. For a brief introduction to variables, see
Understanding variables.
Creating a table
1 Start a new table and switch to the Define tab.
2 On the Table List toolbar, click the Create table icon

.
This adds a new table to the Table List, selects it, and if necessary, switches to the Define tab.
▪Define the table in the Table Definition section by selecting the age variable from the Variable List.
▪Define the table in the Table Definition section.
3 In the Variable List, select the age variable.
4 Click Click to add in the Side axis or drag the icon next to the age variable and drop it on Click to add in the Side axis.
5 In the Variable List, select the gender variable.
6 Click Click to add in the Top axis or drag the icon next to the gender variable and drop it on Click to add in the Top axis.
7 You have now completed defining the structure of the table. To see the finished table, click the
Populate icon

.
This switches to the View tab and starts the internal process required to populate the table. This involves UNICOM Intelligence Reporter - Survey Tabulation accessing the responses stored in the case data and calculating and displaying the values in the table cells.
8 Switch back to the Define tab and click the Advanced View button in the Table Definition section. Look at the axis specifications in the Top and Side text boxes. Note that the specification for each axis is just the name of the variable. Another way of creating the table is to drag the icons for the variables into the Side and Top text boxes or to type the names of the required variables directly into the Side and Top text boxes.
9 Before creating the next table, switch back to the View tab and look at the table again. The table shows two figures in each table cell. These are known as the
cell contents and, because you have not explicitly defined the cell contents you want to show, the default cell contents are used. These are counts (which show the number of respondents that satisfy the row and column conditions for each cell) and column percentages. See
Cell contents for more information.
Changing the default cell contents
Change the default cell contents so that only the counts appear.
1 Switch to the Preferences tab and click Modify to open the Modify Cell Items dialog box.
2 Highlight Column Percentages in the Show items in this order list, and click the Remove button.
3 Click OK to close the dialog and return to the Preferences tab.
4 Choose Set as Default at the top of the Preferences tab. This means that the current table and all tables that you create from now on contain only counts.
5 To see the changes in the current table, switch to the View tab and click Populate.
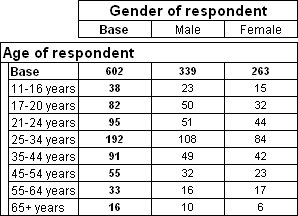
Table of age by gender showing only counts
See also