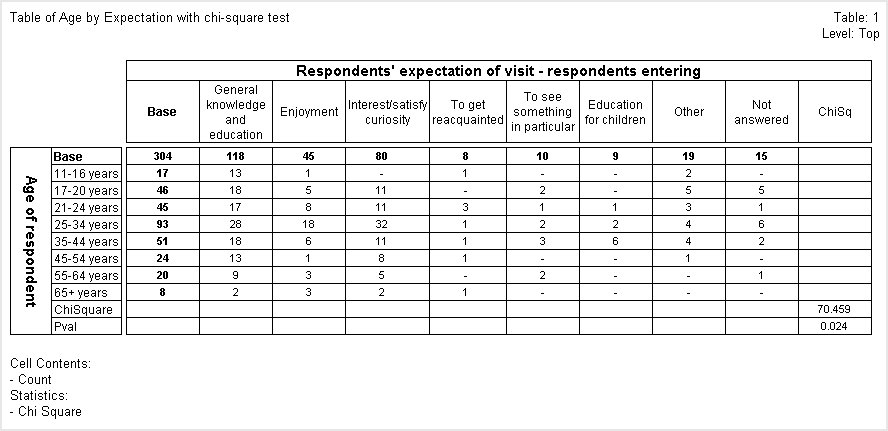
The chi-square test in this example tests whether there is an association between respondents' expectations of their visit to the museum and their age.
Note that UNICOM Intelligence Reporter - Survey Tabulation has added two rows to the table below the rows formed from the categories of the age variable. It also has added a column to the right of the columns formed from the categories of the expect variable. The cell at the intersection of the first additional row and column displays the chi-square statistic. In this table, the chi-square statistic is 70.459. The table also shows the p value for this chi-square value, based on the degrees of freedom for the table (you can see the degrees of freedom in the diagnostics file: see
Diagnostics information). In this case, the p value of 0.024 indicates that there is approximately a 2.5% chance that the results are due to chance, and therefore a 97.5% probability that there is a significant relationship between respondents' expectations of their visit and their age.