Examples of the column proportions test
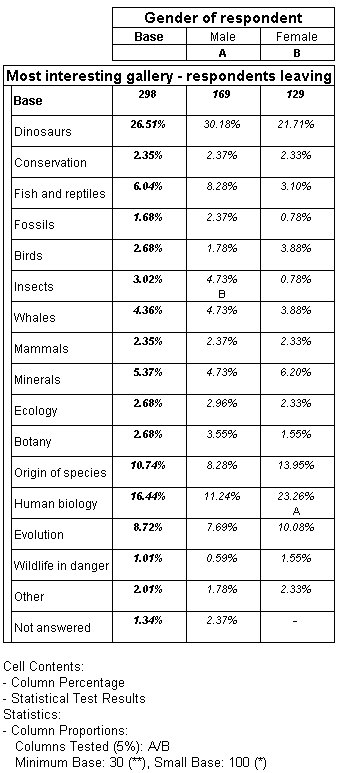
The first column proportions test in this example tests whether there are any significant differences in the proportions of male and female respondents who found the different galleries most interesting.
Table showing column proportions test
Notice that UNICOM Intelligence Reporter - Survey Tabulation has assigned IDs of A to the Male column and B to the Female column and that these are displayed below the column headings. Notice the B below the cell contents in the Male cell of the Insects row, and the A below the cell contents in the Female cell of the Human biology row. For the Insects row, this indicates that the proportion of male respondents is higher than the proportion of female respondents and that this difference in proportions is statistically significant at the 5% significance level. For the Human biology row, this indicates that the proportion of female respondents is higher than the proportion of male respondents and that this difference in proportions is statistically significant at the 5% significance level.
The column proportions test in this table shows that, although the proportions of male and female respondents who found the different galleries most interesting vary, the differences are statistically significant only for the Insects and Human biology galleries. The differences in the preferences for all of the other galleries can be explained by chance.
For an example of this table that displays only rows with significant results, see
Adding a minimum p value to a table.
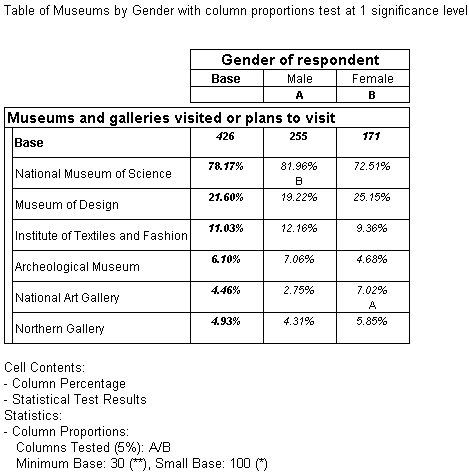
The next example tests whether there are any significant differences in the proportions of male and female respondents who visited or planned to visit other museums.
Table showing column proportions test
Notice that UNICOM Intelligence Reporter - Survey Tabulation has assigned IDs of A to the Male column and B to the Female column and that these are displayed below the column headings. Notice the B below the cell contents in the Male cell of the National Museum of Science row, and the A below the cell contents in the Female cell of the National Art Gallery row. For the National Museum of Science row, this indicates that the proportion of male respondents is higher than the proportion of female respondents and that this difference in proportions is statistically significant at the 5% significance level. For the National Art Gallery row, this indicates that the proportion of female respondents is higher than the proportion of male respondents and that this difference in proportions is statistically significant at the 5% significance level.
The column proportions test in this table shows that, although the proportions of male and female respondents who found the different galleries most interesting vary, the differences are statistically significant only for National Museum of Science and National Art Gallery. The differences for all of the other named museums can be explained by chance.
See also