Survey Tabulation > Statistical tests > Paired preference test > Statistical formula for the paired preference test
 
Statistical formula for the paired preference test
The paired preference element is usually specified as a row element to compare two rows for each column independently. However, you can specify it as a column element to compare two columns for each row independently. The following information assumes specification as a row.
The following table shows the formulae used for conducting the paired preference test in UNICOM Intelligence Reporter - Survey Tabulation.
Notation
Description
w o
Sum of the weights for the column.
w o 2
Sum of the squared weights for the column.
e o = (w o)2 / w o 2
Effective base for the column.
c i
Sum of the weights for the cell in the i throw.
c j
Sum of the weights for the cell in the j th row.
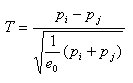
p i = c i/w o
Column proportion in the i throw.
p j = c j/w o
Column proportion in the j throw.
Test statistic
Under the null hypothesis H o : p i = p j
the paired preference test statistic is calculated using the following expression:
The test is undefined if p i = p j = 0 or if e o < 2.
P values
p values are computed using the t distribution with e o -1 degrees of freedom.
References
Kish, L (1965), Survey Sampling, New York: John Wiley and Sons. ISBN 0-471-48900-X.
See also
Examples of the paired preference test
Details and restrictions of the paired preference test
Paired preference test