Displaying charts
You can display variables in UNICOM Intelligence Reporter - Survey Tabulation in the form of a chart (charting is disabled by default). UNICOM Intelligence Reporter - Survey Tabulation requires Microsoft Office Web Components for charting. Refer to the UNICOM Intelligence Installation Guide for information on installing Microsoft Office Web Components. Refer to
HTML Exports dialog box for information on enabling charts in UNICOM Intelligence Reporter - Survey Tabulation.
To display a chart
1 Create a table using the Define Table tab.
2 Click the Populate button to populate the table and switch to the View Table tab.
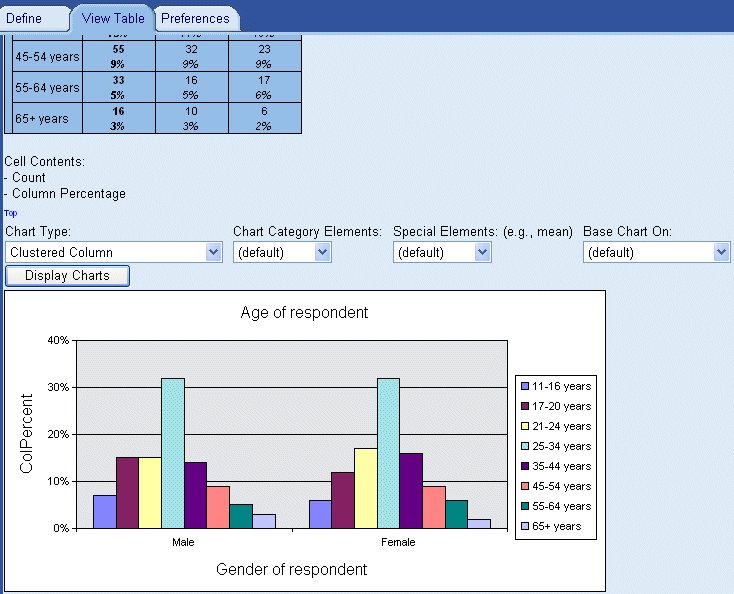
3 Below the table, a Chart Type list appears. Choose the type of chart you want to display and click the Display Charts button. The chart is displayed below the table:
Data from table of Age by Gender displayed as a chart
Notes
▪If a table contains no data, no chart is displayed.
▪By default, charts are displayed for column percentages. For tables that do not contain column percentages, charts are displayed for counts. For tables that do not contain either column percentages or counts, charts are displayed for the first cell item in the table.
▪Charts are not saved in table documents. To see charts for a saved table document, you need to repopulate the tables.
See
Understanding charts for more information.
See also