Loops and grids
Market research questionnaires often contain individual questions and sets of questions that are asked more than once. For example, questionnaires often contain grid questions that ask respondents to choose a rating on a predefined scale for a number of products in a list, and sets of questions that respondents are asked to answer for each product in a list of products or for each person in a household.
The number of times the question or set of questions is to be asked can be controlled in three main ways:
▪By the categories in a category list. For example, "For each brand in the following list, please answer the following..."
▪By a numeric expression that has a known upper limit. For example, "For each of the first three journeys you described earlier, please answer the following..."
▪By a numeric expression that has an unknown upper limit. For example, "For each drink you consumed last week, please answer the following..."
Each of these constructions is a loop that defines the question or set of questions and the number of times they are to be asked (or, in more technical terms, the number of times the loop is to be iterated). When you analyze the data in UNICOM Intelligence Reporter - Survey Tabulation, whether the questions in the loop were asked simultaneously as a grid or sequentially (one after the other) is not really relevant.
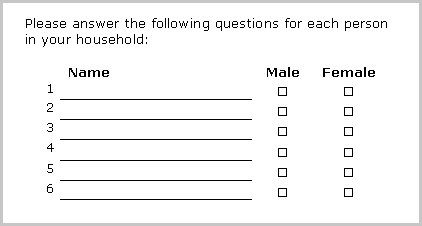
To understand how it works, consider the following loop, which is presented here in a grid-like format:
Numeric loop
This loop contains two questions, Name and Gender, which are asked up to 6 times. This means that the loop has 6 iterations.
When the response data is presented in a non-hierarchical form, it is "flattened" and a separate variable stores the responses to each question in each possible iteration. In this example, there would be 12 variables (2 * 6). For example, if the loop is called MyLoop, the following variables would store the responses:
MyLoop[1].Name
MyLoop[2].Name
MyLoop[3].Name
MyLoop[4].Name
MyLoop[5].Name
MyLoop[6].Name
MyLoop[1].Gender
MyLoop[2].Gender
MyLoop[3].Gender
MyLoop[4].Gender
MyLoop[5].Gender
MyLoop[6].Gender
These are the full names of the variables and they are constructed from the names of the loop and the questions inside the loop. [] (brackets) indicate an iteration; . (single period) indicates a parent/child relationship.
This method of representing hierarchical data is simple and effective. However, it has some disadvantages, the most obvious one being that the number of variables is fixed. In the household example, this means that storage space is reserved for the responses of six individuals in each household even though many households have fewer people. Conversely, responses cannot be stored for any additional people in large households. Another disadvantage is that performing summary calculations on the data can be difficult.
Representing the case data hierarchically can be more flexible and provides advantages during analysis. The loop is then considered a level and the responses to the questions in the loop are stored in a separate hierarchical table named after the loop. In this example, the hierarchical table would contain two variables, one for each of the questions in the loop, and will store the responses to each iteration in a separate row. The full names of these variables would be:
MyLevel[..].Name
MyLevel[..].Gender
Note that .. (two periods) are used in place of an iteration number, to indicate all iterations.
Whether UNICOM Intelligence Reporter - Survey Tabulation represents the data hierarchically or flattened depends on the format of your case data. By default, UNICOM Intelligence Reporter - Survey Tabulation represents the data hierarchically when it is stored in the relational MR database (RDB 2) or Quanvert formats. UNICOM Intelligence Reporter - Survey Tabulation represents the data in a flattened form when the data is stored in a UNICOM Intelligence log file, an SPSS .
sav file, or the Quancept QDI/DRS format. When the data is stored in an XML file, you may need to select the appropriate representation according to how the XML file has been set up. See
Changing the view for more information.
In some data formats, some loops can be represented both hierarchically and flattened. These loops are known as expanded loops. However, this is not possible when the maximum number of iterations has not been defined (these loops are sometimes referred to as unbounded loops).
A grid is a special case of a loop, in which the iterations are controlled by a category list and when the grid question is asked, all of the iterations are presented simultaneously. In the Museum survey there is a grid question that asks respondents to rate the galleries in the museum:
Rating grid
In this grid, the list of galleries is the controlling category list, the grid itself is called rating and the categorical question inside the grid is called column. The full names of the individual variables that store the flattened responses to the grid are:
rating[{Dinosaurs}].Column
rating[{Conservation}].Column
rating[{Fish_and_reptiles}].Column
rating[{Fossils}].Column
rating[{Birds}].Column
rating[{Insects}].Column
rating[{Whales}].Column
rating[{Mammals}].Column
rating[{Minerals}].Column
rating[{Ecology}].Column
rating[{Botany}].Column
rating[{Origin_of_species}].Column
rating[{Human_biology}].Column
rating[{Evolution}].Column
rating[{Wildlife_in_danger}].Column
rating[{Other}].Column
These are sometimes referred to as grid slices.
See also


