UNICOM Intelligence Reporter Server Edition guidelines and suggested limits
Introduction
UNICOM Intelligence Reporter Server Edition provides different performance levels than the Desktop version, because it relies on shared server resources and overall network status. When opening a document in UNICOM Intelligence Reporter Server Edition, the entire document (metadata and tables) must be transferred to the client. Similarly when populating tables, the table definitions are transferred to the server and the results back to the client. Because the table generation process is on more powerful server, it is possible that UNICOM Intelligence Reporter Server Edition can populate the tables faster than the Desktop version.
The objective of this white paper is to summarize the UNICOM Intelligence Reporter Server Edition limits, that are based on a series of test results, and to provide guidelines for effective UNICOM Intelligence Reporter Server Edition usage.
Test environment
UNICOM Intelligence Reporter Server Edition
|
Hardware
|
Software
|
|
Intel Core i7-3720QM CPU @2.6GHz
|
Windows 2008 R2 (x64)
|
|
2GB memory
|
Microsoft SQL Server 2008 R2
|
|
|
UNICOM Intelligence Server 7.0.1 (x64) single server site installation with FMROOT pointing to a remote file server
|
WDR client
|
Hardware
|
Software
|
|
Intel Core i7-3720QM CPU @2.6GHz
|
Windows 2008 R2 (x64)
|
|
2GB memory
|
Microsoft Internet Explorer 11
|
UNICOM Intelligence Reporter Server Edition guidelines and suggested limits
Test 1: Open MDD files that work with minimal case data
Test 1 test data parameters
|
Metadata
|
Variable count in MDD
|
100
|
1000
|
2000
|
5000
|
8000
|
10000
|
15000
|
|
|
File size (MB)
|
0.6
|
4.01
|
7.84
|
19.32
|
31.09
|
38.92
|
58.56
|
|
Case Data
|
Case count in DDF
|
125
|
125
|
125
|
125
|
125
|
125
|
125
|
|
File size (MB)
|
0.2
|
0.5
|
0.9
|
2.28
|
4.28
|
4.31
|
6.41
|
Note All variables in the MDD files are categorical, and each variable has 20 categories.
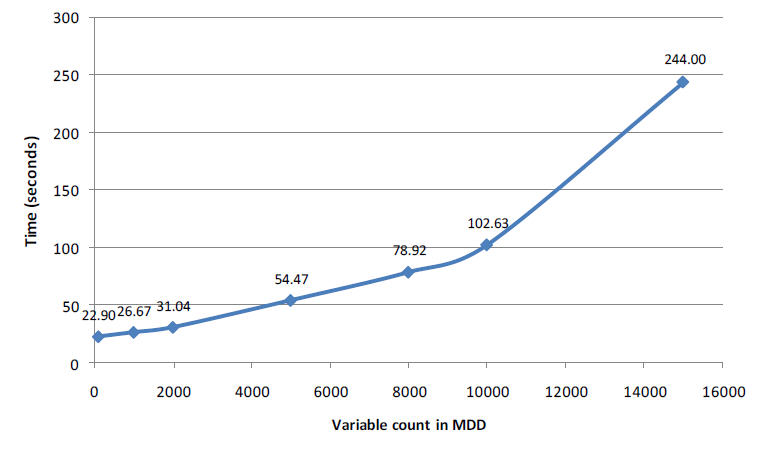
Test 1 results: The loading time to open each MDD in UNICOM Intelligence Reporter Server Edition
The results show that when the variable count of the MDD increases to more than 5000, the time to open UNICOM Intelligence Reporter Server Edition increases to approximately 60 seconds (1 minute).
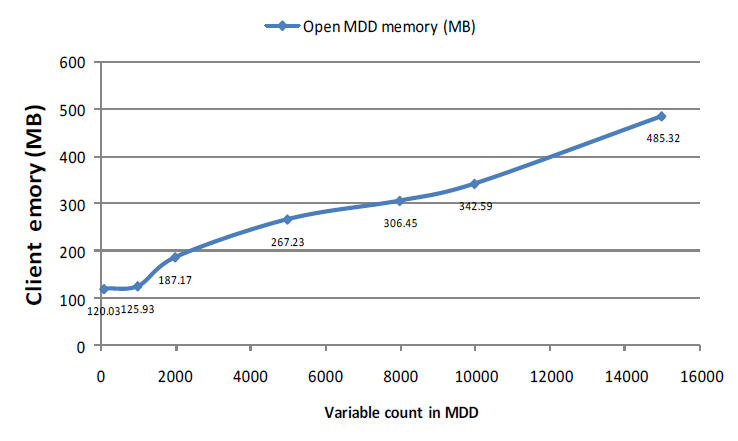
Test 1 results: Memory usage after loading an MDD in UNICOM Intelligence Reporter Server Edition
The client memory usage increases fairly linearly. The memory usage is acceptable and it is likely that users will encounter problems with the open time before they encounter memory usage problems.
Test 2: Populate simple tables with the data from Test 1
The following tables are used:
▪Simple cross tabulation: Var1 * Var2
▪Concatenated variables: (Var1+Var2) * (Var3+Var4)
▪Nested variables: (Var1>Var2) * (Var3>Var4)
Because all variables in the test metadata contain 20 categories, the following table sizes are the result:
▪Simple cross tabulation: 20 * 20 = 400 cells
▪Concatenated variables: (20+20) * (20+20) = 1600 cells
▪Nested variables: (20>20) * (20>20) = 160,000 cells
Note The population test results do not include the first population after loading the metadata. See Test 3 for information regarding the difference between the first population and subsequent populations.
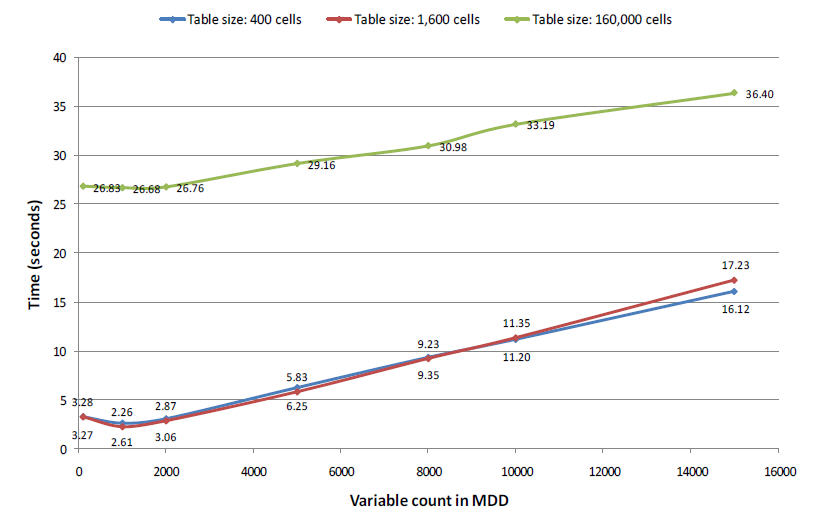
Test 2 results: Time required to populate simple tables
Because the case data size is very small, the data aggregation process does not consume much time. For the 160,000 cell table, approximately 22 seconds is used to display the table in the Results tab. The reason is that UNICOM Intelligence Reporter Server Edition is reliant on Microsoft Internet Explorer. No significant improvement is seen when running the 160,000 cell table on UNICOM Intelligence Reporter Desktop Edition.
Test 3: Initial table population versus subsequent populations
The first time populating any table in UNICOM Intelligence Reporter Server Edition requires additional time due to the case data component initialization on the server. The test compares the initial population with subsequent populations against a simple table (20 * 20 (400 cells)).
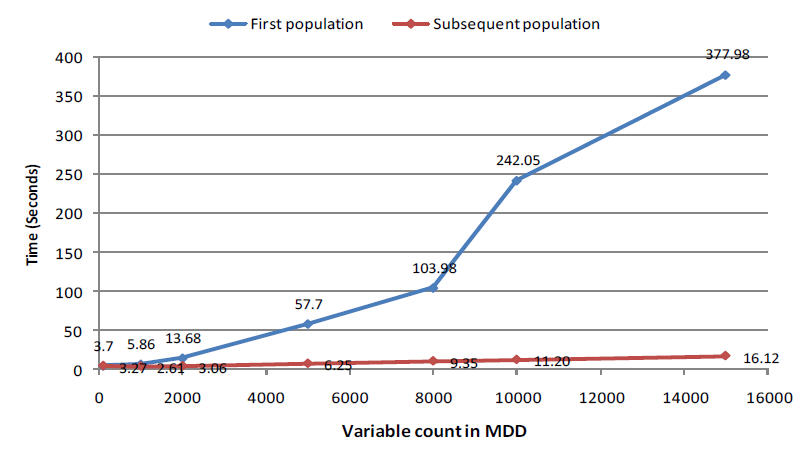
Test 3 results: Initial population versus subsequent populations (400 cells)
The results show that the time to initially populate a table is considerable. The behavior is completely independent of the actual table that was populated. In cases where the MDD variable count can increase to more than 2000, it is advisable to use a small table when first starting UNICOM Intelligence Reporter Server Edition.
MTD file size
Test 4: Populate an incrementally sized table
Using an MDD file that includes 2000 multiple-response variables, and 23,350 records in the case data (DDF format), serial tables were created with incremental element counts (for example, 20*20, (10+10)*20, (20+10)*20...).
Test 4: Populate an incrementally sized table
Item | Description | Number |
|---|
Metadata | Variable count in MDD | 2000 |
| File size (MB) | 6.19 |
Case Data | Case count in DDF | 23350 |
File size (MB) | 1470 |
When populating tables without statistical tests, UNICOM Intelligence Reporter Server Editionrequires the same amount of time to generate results for each kind of table structure. The maximum amount of time required is 2 - 3 seconds. However, the table structure significantly impacts overall performance when populating tables that include column proportions statistics.
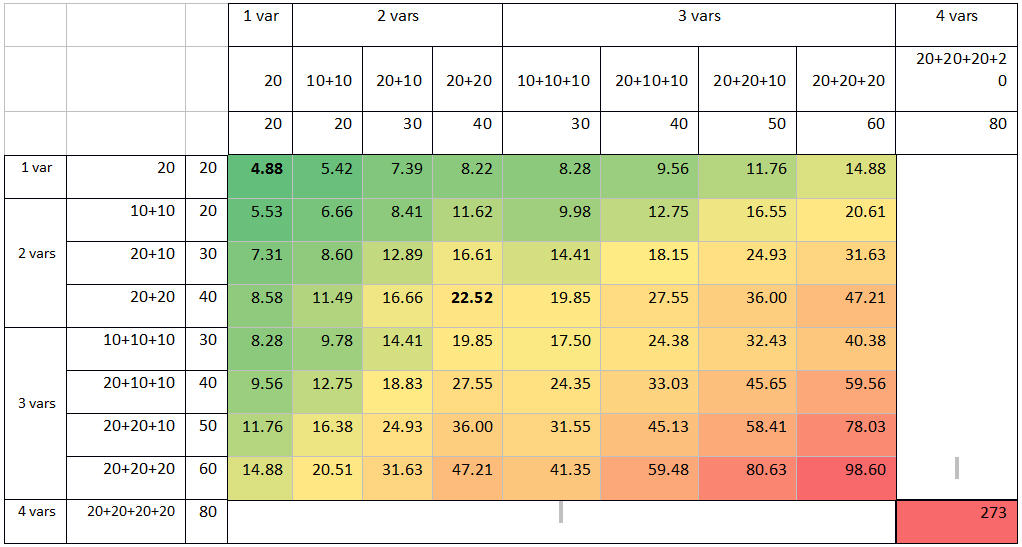
Test 4 results: Time to populate an incrementally sized table that includes column proportions statistics
The following chart shows the time usage (in seconds) for specified elements that are contained on the side and top axis. For example, the first cell has a value of 4.88, which means that table 20*20 needs 4.88 seconds to populate. The last cell shows that the table (20+20+20+20)* (20+20+20+20) takes 273 seconds to populate.
The test results provide the following conclusions:
▪An increase in axis variables results in more processing time. For example, when the total number of elements is 30, an axis with 3 variables is slower than an axis with 2 variables.
▪With any specified variable count, more table cells require more processing time.
▪The table structure (20+20+10)*(20+20+10) requires about 60 seconds to populate. Large tables should not be created with this structure when the case data has more than 20K records. Care must be taken when applying the column proportions test. The table can take a long time to populate when you have variables that are truly multiple response, and contain a large number of columns and cells.
▪The hidden element does not improve performance.
Test 5: PKD versus DDF case data
Test 4: Populate an incrementally sized table
Metadata | Variable count in MDD | 2000 |
|---|
| File size (MB) | 6.19 |
Case Data | Case count in DDF | 23350 |
File size (MB) | 1470 |
Test 5: PKD versus DDF case data
Metadata | Variable count in MDD | 1100 |
|---|
| File size (MB) | 31.8 |
Case Data | Case count in DDF | 248388 |
File size (MB) | 1413.12 |
Case count in PKD | 248388 |
File size (MB) | 77.3 |
MTD | Every table structure | 2437*17 |
File size (MB) | 13.39 |
The test includes 24 similarly structured tables that are defined in UNICOM Intelligence Reporter Server Edition. No statistical tests are applied to the tables (but the tables do include filters).
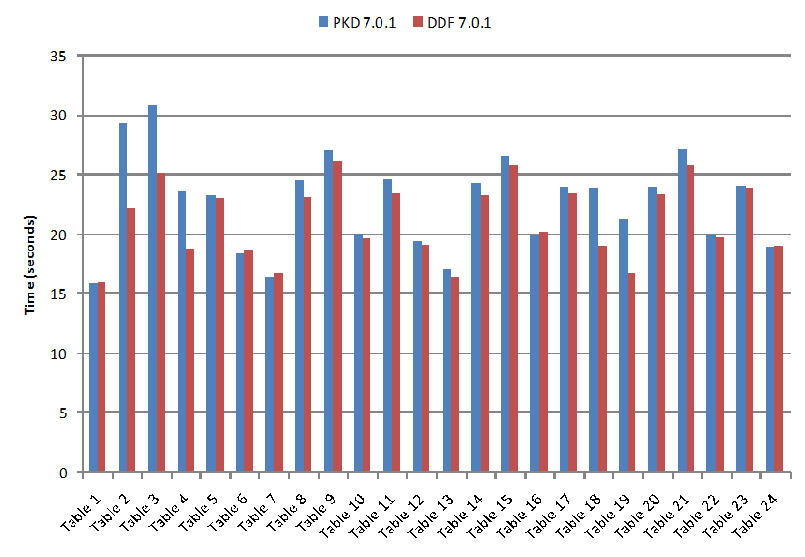
Test 5 results: Time to populate tables using DDF and PKD files as case
The following table presents the time required to populate each table:
The results show that case data that is stored in PKD files are, on average, 5% slower than case data that is stored in DDF files. DDF is the optimum case data choice for UNICOM Intelligence Reporter Server Edition.
Test 6: DDF 6.0.1 versus DDF 7.0.1
Metadata | Variable count in MDD | 1100 |
|---|
| File size (MB) | 31.8 |
Case Data | Case count in DDF | 248388 |
File size (MB) | 1413.12 |
MTD | Every table structure | 2437*17 |
File size (MB) | 13.39 |
The tests were run on two UNICOM Intelligence server versions:
▪UNICOM Intelligence 7.0.1
▪UNICOM Intelligence 6.0.1 Fix Pack 1 + Interim Fix 187A
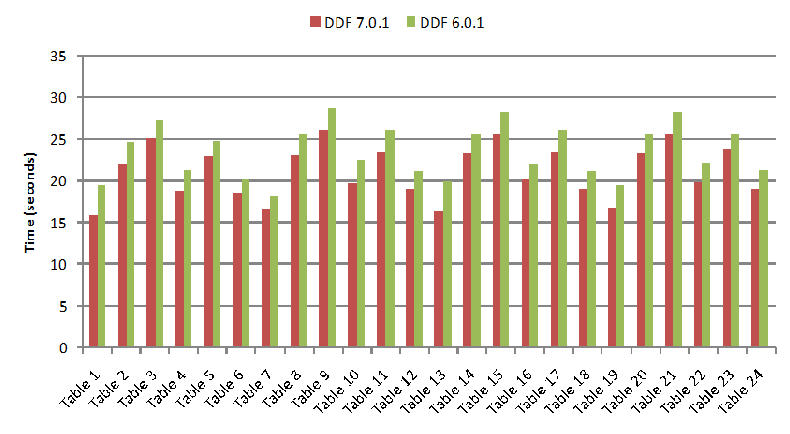
Test 6 results: Populate tables using DDF
The results show that UNICOM Intelligence 7.0.1 is, on average, 10% faster than UNICOM Intelligence 6.0.1 when using DDF case data. Although every table has the similar structure 2437*17 (41429 cells), the population time usage values are not as close. This is possibly due to different filters that are defined for the various tables. Two elements become apparent when examining each table filter: variable count and condition count. The variable count was tested and found not to be a factor (the document omits the result). When considering the condition count, all boolean expressions are counted in the filter. For example, the following filter syntax is treated as 6 conditions.
Var1.ContainsAny({Element1}) And Var2.ContainsAny({Element2, Element3, Element4})
And (Var3.ContainsAny({Element5}) Or Var4.ContainsAny({Element6})) And Var4.ContainsAny({Element7})
And Not Var5.ContainsAny({Element8})
The condition counts that are defined for each filter are as follows:
Condition counts that are defined for each filter
Table number | Table 1 | Table 2 | Table 3 | Table 4 | Table 5 | Table 6 |
Filter condition count | 6 | 15 | 18 | 10 | 15 | 9 |
Table number | Table 7 | Table 8 | Table 9 | Table 10 | Table 11 | Table 12 |
Filter condition count | 7 | 16 | 19 | 11 | 16 | 10 |
Table number | Table 13 | Table 14 | Table 15 | Table 16 | Table 17 | Table 18 |
Filter condition count | 7 | 16 | 18 | 11 | 16 | 10 |
Table number | Table 19 | Table 20 | Table 21 | Table 22 | Table 23 | Table 24 |
Filter condition count | 7 | 16 | 19 | 11 | 17 | 10 |
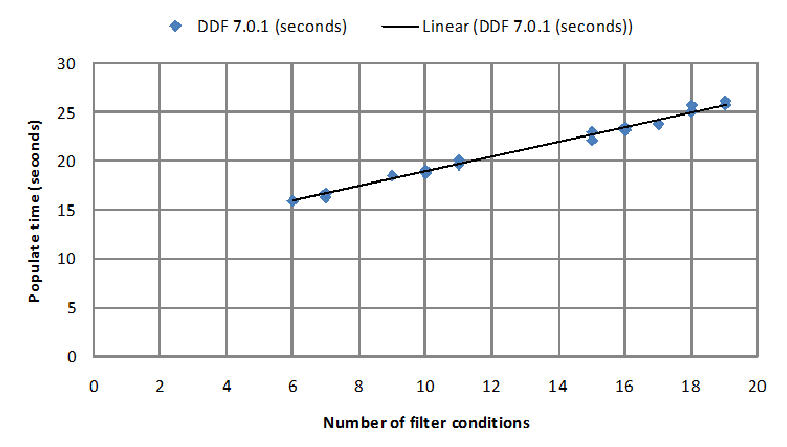
The following chart shows the relationship between the table filter conditions and the table population time in the UNICOM Intelligence 7.0.1 environment:
The data fits a fairly linear trend. Using more filter conditions results in more table population time. Care must be taken when increasing the condition count in the table or global filters.
Test 7: Load and populate incrementally sized tables
Metadata | Variable count in MDD | 2000 |
|---|
| File size (MB) | 6.19 |
Case Data | Case count in DDF | 23350 |
File size (MB) | 1470 |
The MDD file includes 2000 multiple-response variables. 7 MTD documents, that each contain 800 tables, were created. For each table, the structure has incremental element counts (for example, 20*20, 20*20+20, 20+20*20+20...). The table cells only vary between the different variables, and all of tables contain no stats or filters. The test records two data attributes: opening the MTD, and then populating the tables.
Test 7 results: Performance when populating 800 incrementally sized tables
| | | Open MTD in UNICOM Intelligence Reporter Server Edition without previous population results |
|---|
MTD file size (MB) | Table structure | Cell / Var count | Load time (seconds) | Memory after loading (MB) | Total population time (seconds) | Memory after population (MB) |
6.56 | 20*20 | 400 / 2 | 19.66 | 235.06 | 124.43 | 492.82 |
8.37 | 20*20+20 | 800 / 3 | 21.83 | 260.43 | 210 | 596 |
10.18 | 20+20*20+20 | 1600 / 4 | 22.96 | 269.08 | 394.56 | 814.18 |
10.18 | 20+20+20*20 | 1200 / 4 | 24.28 | 279.52 | 319.06 | 833.38 |
11.98 | 20+20+20+20*20 | 1600 / 5 | 24.7 | 279.25 | 415.71 | 866.82 |
13.79 | 20+20+20+20+20*20 | 20000 / 6 | 27.48 | 298.12 | Error occurred 1 | - |
15.6 | 20+20+20+20+20+20*20 | 24000 / 7 | 29.01 | 304.48 | Error occurred 1 | - |
1 Get warn: The maximum request length was exceeded, because the populate request string is too large to invoke remote UNICOM Intelligence Reporter Server Edition with the default Web Service buffer.
The results show that loading 800 tables requires less than 30 seconds, even when the table structure grows very large. The table population performance decreases significantly when more variables are introduced onto an axis. The default Web service request limits prevent the successful population of 800 tables when the table structure is larger than (1600 cells, 4 variables).
Test 8: Load and populate an incremental number of tables
Metadata | Variable count in MDD | 2000 |
|---|
| File size (MB) | 6.19 |
Case Data | Case count in DDF | 23350 |
File size (MB) | 1470 |
11 MTD documents are created to contain an incremental number of tables (800, 1600, 2400, 3200...), but all table structures are 20*20 (400 cells). Similar to Test 7, the tables attempt to use various metadata variables as much as possible, and all tables contain no filters. The test also records two data attributes: opening the MTD, and then populating the tables.
Test 8 results: Performance when loading and populating an incremental number of tables
All tables are 20*20 and include stats (grid overlap)
MTD file size (MB) | Table count in MTD | Load time (seconds) | Memory after loading (MB) | Total population time (seconds) | Memory after population |
|---|
7.24 | 800 | 24.58 | 246.64 | 2015 | 561.64 |
14.55 | 1600 | 41.6 | 310.75 | >43200 (12h)1 | 573 |
21.8 | 2400 | 67.71 | 345.42 | - | - |
29.1 | 3200 | 111.83 | 422.05 | - | - |
36.42 | 4000 | 135.63 | 439.4 | - | - |
43.65 | 4800 | 194.9 | 463.61 | - | - |
50.97 | 5600 | 252.2 | 503.78 | - | - |
54.63 | 6000 | 285.78 | 523.55 | - | - |
58.22 | 6400 | 325.55 | 544.42 | - | - |
61.86 | 6800 | 368.73 | 562.97 | - | - |
65.52 | 7200 | 391.9 | 582.97 | - | - |
1 The accurate time should be more than 12 hours. The server process w3wp.exe hung for several hours after the memory usage reached 2GB. All tables populated without error.
Populating all tables is extremely slow after the UNICOM Intelligence Reporter Server Edition table number exceeds 800. As a result, only 800 and 1600 tables have a recorded population time. The test server was limited to 2GB of memory. More than 8GB memory would allow the 1600 tables to be populated within an hour.
Test summary and guidelines for improving performance
Loading data
▪The time required to open an MDD file increases with the number of variables the MDD file contains. An MDD with 5000 variables can be opened in about 1 minute. As such, more than 5000 variables should not be defined in a single MDD file.
▪The first population run will take significantly longer than subsequent population runs. As such, a small table should be the first table populated after first starting UNICOM Intelligence Reporter Server Edition.
▪When compared with PKD files, DDF files prove to be better case data choices when working with UNICOM Intelligence Reporter Server Edition.
▪UNICOM Intelligence 7.0.1 exhibits superior performance over UNICOM Intelligence 6.0.1 (including relevant fix packs).
Defining tables
▪An increase in axis variables results in more processing time, and with any specified variable count, more table cells require more processing time. Please consider reducing the variable count in tables and reducing the expressions in derived variables.
▪When the cell count of one table increases to a large number (such as 160,000), the performance to display the table in the Results tab will take additional time. Although the hidden elements do not improve performance in the table population, they are able reduce the time to export and display the results. Please set the proper condition to hide rows/columns once there are large number of cells in the table.
▪Care must be taken when applying the column proportions test. The table can take a long time to populate when variables are truly multiple response, and the table includes a large number of columns and cells. Review the statistical formulas and the number of columns being tested and apply statistical tests only when needed. The table statistical test definition must be verified when using PKD files as the metadata source.
▪Numerous filter conditions will result in more time to populate a table. It is best to reduce the condition count in tables and global filters.
▪More than 800 tables should not be populated at the same time.
See