Developer Documentation Library > Interviewer - Server > Architecture > Interview Service tier > Dialer Interface component > Call log analysis for the predictive dialing algorithms > Call outcomes
 
Call outcomes
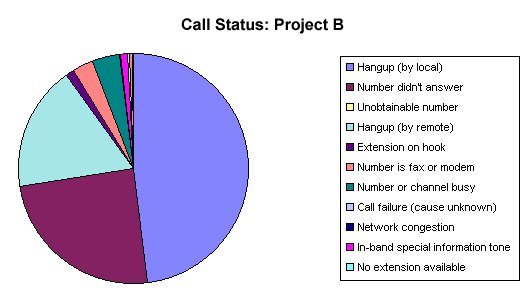
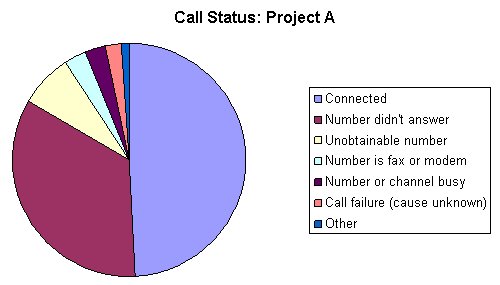
The table shows the call outcomes for all calls dialed for projects A and B.
Status
Base
Project A
Project B
Base
485666
100.00%
383863
100.00%
101803
100.00%
Hangup (by local)
220281
45.26%
171392
44.65%
48889
48.02%
Number didn't answer
156255
32.17%
131401
34.23%
24854
24.41%
Unobtainable number
28436
5.86%
28436
7.41%
Hangup (by remote)
19739
4.06%
1687
0.44%
18952
17.73%
Extension on hook
16529
3.40%
15335
3.99%
1194
1.17%
Number is fax or modem
14926
3.07%
11986
3.12%
2940
2.89%
Number or channel busy
14458
2.98%
10572
2.75%
3886
3.82%
Call failure (cause unknown)
9330
1.92%
9226
2.40%
104
0.10%
Network congestion
1711
0.35%
1711
0.45%
In-band special information tone
1159
0.24%
62
0.02%
1097
1.08%
No extension available
812
0.17%
631
0.16%
181
0.18%
No trunks available (and similar)
703
0.14%
703
0.18%
In-band recorded announcement
566
0.12%
110
0.03%
456
0.45%
Number incomplete (never rung)
386
0.08%
287
0.07%
99
0.10%
Number out of order
321
0.07%
321
0.08%
In-band fast busy (reorder) tone
51
0.01%
51
0.05%
Call rejected
2
*
2
*
Internal dialer error
1
*
1
*
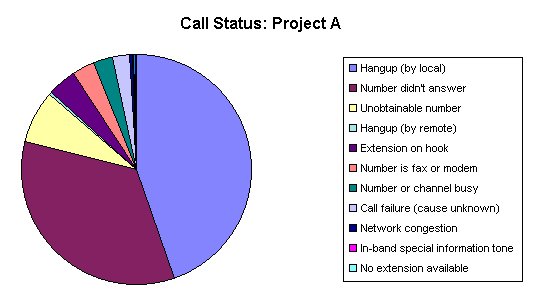
These results can be depicted as follows:
Call status for Project A; all calls and outcomes
This graphic is described in the surrounding text.
Call status for Project B; all calls and outcomes
This graphic is described in the surrounding text.
Connected calls correspond to calls that have a call outcome of local hangup, remote hangup, or extension on hook. For Project A this was 188414 calls out of the 383863 dialed, or 49.1%. For Project B this was 68135 of the 101803 dialed, or 66.9%. These connect rates correspond to failure rates of 50.9% and 33.1% respectively. The most common reason for calls failing to connect is no answer, which is higher for residential Project A than for business Project B. Project A also had 7.4% of calls resulting in "Unobtainable number" and 2.4% as "Call failure (cause unknown)", while Project B had virtually none of these outcomes. This is probably a result of the Project A sample including a percentage of random digit dialing.
Of the other calls that failed to connect, a small percentage (around 3% to 4% of calls) was to busy numbers and about 3% were fax machines. The other possibilities for call failures were relatively insignificant at less than 1% of calls dialed.
For silent calls (no extension available), 631 were made for Project A, corresponding to 0.33% of connected calls, and 181 were made for Project B, corresponding to 0.27% of connected calls. Both of these are less than the Ofcom limit of 3% of connected calls.
Call status for Project A; single connect and top five call failures
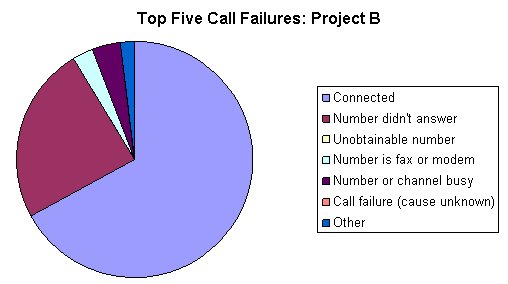
This chart and Call status for Project B; single connect and top five call failures combine local hang-up, remote hang-up, and extension on-hook into a single Connected segment and show only the top five call failures. Project A has a higher no answer percentage and more call failures which result in the percentage of connected calls made for that project being lower. Calls to fax/modems, busy numbers, and other failures are relatively consistent between the two projects and are relatively low (around 4%, 3%, and 1% respectively).
This graphic is described in the surrounding text.
Call status for Project B; single connect and top five call failures
This graphic is described in the surrounding text.
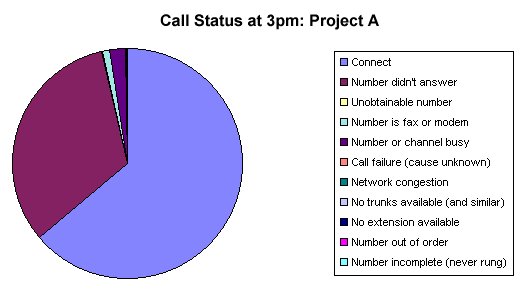
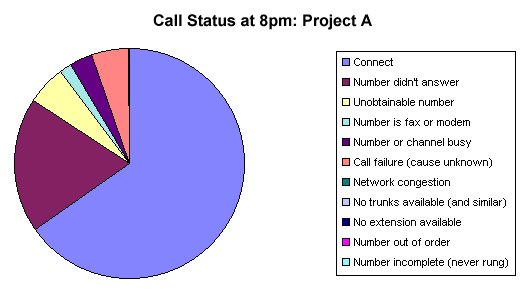
The call outcomes for Project A were also examined with regard to time. Two periods were considered: 3pm to 4pm (near the start of a shift) and 8pm to 9pm (near the end of a shift), both on 6 November. Around 2000 calls were made in both periods. The number of connected calls was constant at 65%, but the number of no answer calls decreased from 32% to 19%, presumably because this was a residential survey and more respondents were home at night. Strangely, there were more failed calls (unobtainable number, unknown call failure) and fax/modems during the later period. Examination of the data for other shifts showed that the number of failed calls varied greatly from hour to hour which suggests that the random phone numbers might not have been distributed evenly throughout the sample.
Call status for Project A: 3pm to 4pm 6 November
This graphic is described in the surrounding text.
Call status for Project A: 8pm to 9pm 6 November
This graphic is described in the surrounding text.
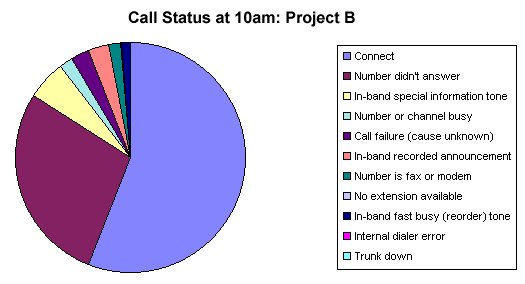
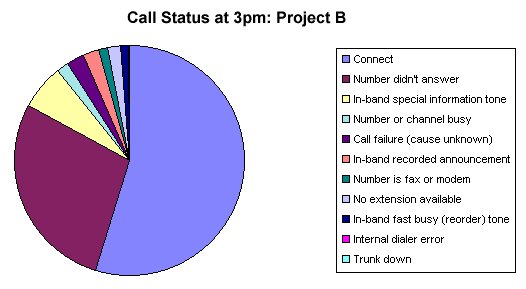
Because of the potential uneven distribution of the sample, a similar analysis was performed on the Project B call logs. Following are charts for two periods (10am to 11am and 3pm to 4pm) for a single project. The call outcome distribution is virtually constant throughout the day; the only difference is in the silent call rates, 0.4% in the first period and 3.1% in the second period.
Call status for Project B: 10am to 11am 6 November
This graphic is described in the surrounding text.
Call status for Project B: 3pm to 4pm 6 November
This graphic is described in the surrounding text.
See also
Call log analysis for the predictive dialing algorithms