Expected values and residuals
Expected values show the count or sum of a numeric variable that would be expected in the cell if the row and column variables were statistically independent or unrelated to each other.
Residuals show the difference between the count or sum of a numeric variable and the expected values. Large absolute values for the residuals indicate that the observed values are very different from the predicted values.
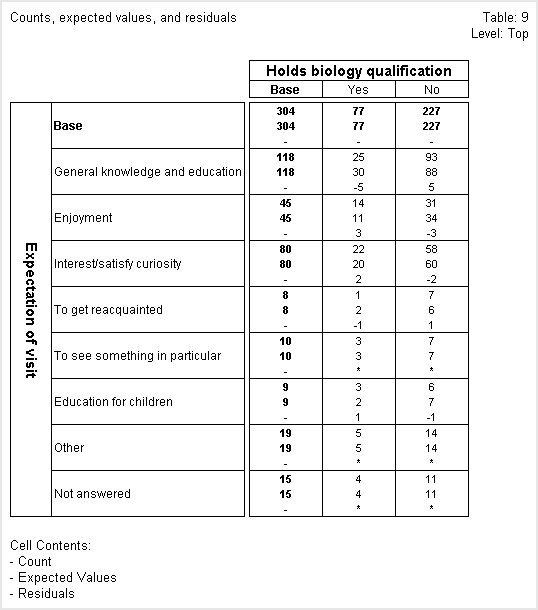
Table showing counts, expected values, and residuals
In the following table, the first figure in each cell is the count; the second is the expected value; and the third is the residual.
“General knowledge and education” shows the biggest discrepancy between the actual counts and the expected values in both the Yes and No columns. However, the actual count is less than the expected value in the Yes column and this is reflected in the negative residual value and the actual count is greater than the expected value in the No column and this is reflected in the positive residual value.
See also

