Changing the table orientation
If you do not want to use the default orientation, you can create the grid table using the opposite orientation, by choosing the Transpose toolbar button

.
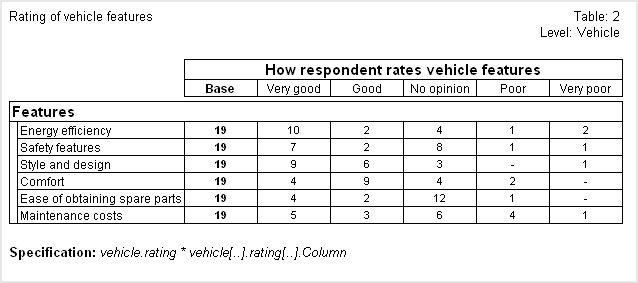
Here is the table, in which the iterations now form the rows:
Table of rating grid with iterations as rows
The table specification has been added to the footers for these tables. This has the following form:
Side axis specification
*
Top axis specification
Notice that in the specifications for the two tables the top and side specifications are reversed.
Grids and loops that contain more than one variable
The vehicle.rating grid contains only one variable: Column. However, some loops contain more than one variable. When you use the Add Grid/Loop method with a grid or loop that contains more than one variable, all of the variables that are contained in the loop are concatenated together in the grid table. Any non-categorical variables that are inside the loop and do not have an axis specification defined are ignored.
For example, in the Household sample, the person loop is defined as expanded (which means that you can use it to create a grid table) and contains more than one variable, so you can use it in this way.
See also
 .
.