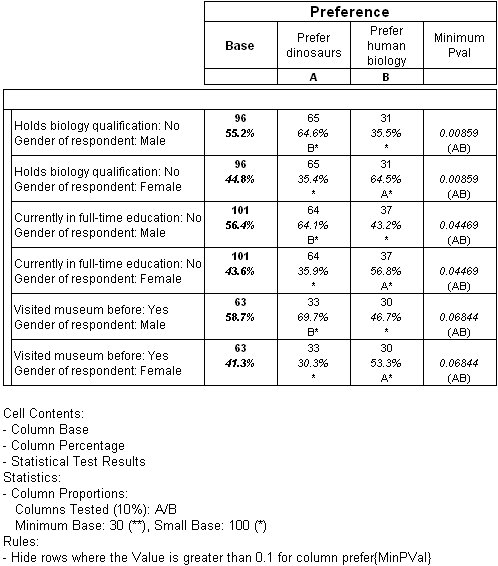
Example of the Product difference test
Sample script file: ProductDifferenceTest.mrs
The examples in this topic are based on the Museum sample data set.
The product difference test in this example is based on a table with gender on the side of the table (the inner variable) and prefer on the top of the table. Three difference attributes are used: education, biology, and before.
The test uses the “three combinations” option (though note that, in this case, the results are the same as for one combination; that is, no additional significant results are found using two and three combinations). Each category from each attribute variable is combined with each item in the side variable. The default settings are used so that the test applied is the column proportions test, with the default significance levels of 5% and 10%, and default minimum base and small base settings of 30 and 100 respectively.
The script begins by specifying the number of variables to combine on the side of the table (also known as difference attributes) in the NSide variable. It also specifies the number of variable combinations to apply in the NCombs variable:
Dim NSide, NCombs
NSide = 3
NCombs = 3
In this case, three difference attribute variables will be used, and three combinations will also be used. This means that a row will be created for all combinations of each category in three variables. Note that when a combination value greater than 1 is used, lower combinations are also included, for example, in this case, one- and two- variable combinations are also created.
The script then specifies a single top variable, a SideInner variable, which is an additional side variable that creates a further layer of combinations over and above those specified by the NCombs variable, and three SideVars, which identify the three variables to use as the difference attributes:
Dim TopVar, SideInner, SideVars[20]
TopVar = "prefer"
SideInner = "gender"
SideVars[0] = "education"
SideVars[1] = "biology"
SideVars[2] = "before"
The script then adds an empty side axis variable called MainSide to the table, and creates a side elements collection:
TableDoc.Tables.AddNew("T1", "axis({}) as MainSide * " + TopVar)
SideEls = TableDoc.T1.Side.MainSide.Elements
SideElno = 0
The script then builds up the side element specification using functions to create an element for each combination of categories in the selected SideVar variables. If a SideInner variable is specified, as in this example, each combination is further expanded by combining it with each category in the SideInner variable. The result is a side axis containing a row for each category combination.
The cell items for the table are adjusted to include a column base cell item as the first item on the table. This is required because otherwise the base would not be visible on the finished table:
TableDoc.T1.CellItems.Clear()
TableDoc.T1.CellItems.AddNew(24, 0)
TableDoc.T1.CellItems.AddNew(1, 1)
A column proportions test is added to the table:
Dim SigLev
SigLev = 10.0
TableDoc.T1.Statistics.Add("ColumnProportions")
TableDoc.T1.Statistics["ColumnProportions"].SigLevel = SigLev
The script displays the minimum p value in a separate column on the table, and sorts the table in ascending order based on the value in this column:
TableDoc.T1.Statistics.ShowMinPVal = True
TableDoc.T1.SortColumn = TopVar + "{MinPVal}"
TableDoc.T1.SortColumn.Order = 0
In addition, a hide rule suppresses any rows where the minimum p value is greater than a value equivalent to the significance level (siglevel/100). This has the effect of hiding any rows that are not significant at the selected level:
Dim R
Set R = TableDoc.T1.Rules.AddNew()
R.Type = 0 ' hide
R.Target = 0 ' row
R.CellItemRef = 1 ' if cellitem 1 (1st non base one)
R.Operator = 4 ' is greater than
R.Value = SigLev / 100.0 ' siglevel / 100
R.ElementRef = TopVar + "{MinPVal}" ' for MinPVal column
R.IgnoreSpecialElements = False ' hide specials as well
Note that, as the table includes a base count in the first cell item position (position 0) the hide rule is based on the second cell item in the table (R.CellItemRef = 1).
See also

