Creating a grid table
Sample script file: MyFirstGridTable.mrs
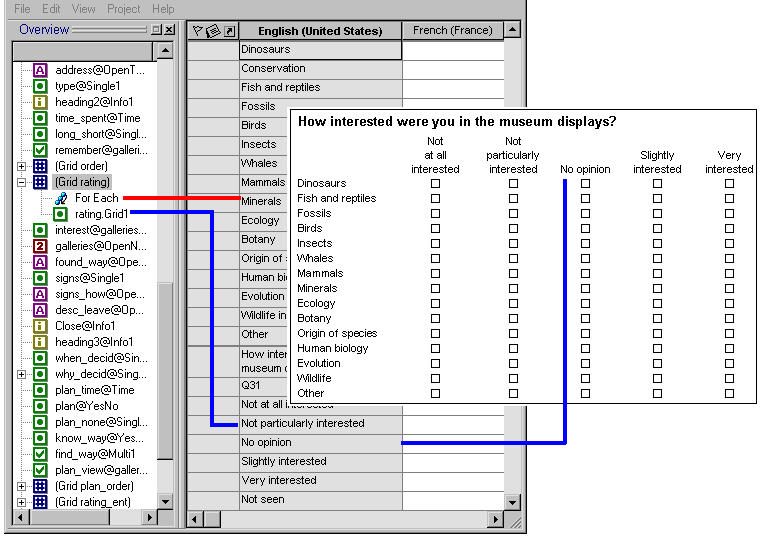
Survey data frequently includes grid questions. These typically ask respondents to choose a rating on a predefined scale for a number of products in a list. For example, the Museum sample survey contains the following grid question (which is called rating):
Rating grid
Table showing rating grid variable
It is generally easier to analyze data collected using a grid question as a grid table. You can create a grid table based on the rating grid question as follows:
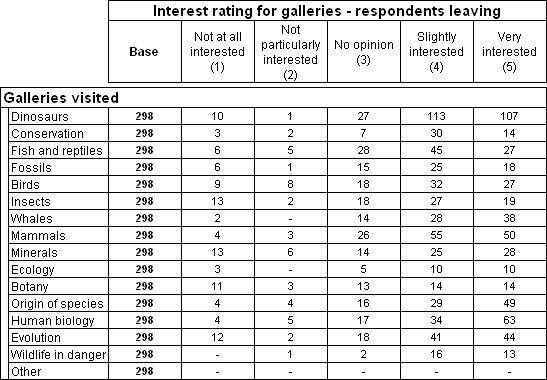
TableDoc.Tables.AddNewGrid("Table1", "rating")
Here is the table produced by the script:
By default, the orientation of the grid table is taken from the definition of the grid question in the metadata. However, you can override the default orientation. For example, if you want the galleries to form the columns, you could use a script like this:
TableDoc.Tables.AddNewGrid("Table2", "rating", 2) ' 2 = doColumn
You can create grid tables only if you are using a data format that supports a hierarchical view of the case data. See
Hierarchical data for more information.
The
TableDoc.Tables.AddNewGrid function cannot be used to add database array variables to the table. Refer to
Creating tables based on database questions for more information.
Requirements
UNICOM Intelligence Reporter
Next
See also


