Sorting profile tables
The table in
Limiting the number of rows displayed displays only the first five rows. The order of the rows is based on the order of the case data in the data set, which is typically in order of the Respondent serial ID (this is generally the order in which the responses were collected, so that people interviewed first appear at the top of the table). However, you might be interested in the responses of people in smaller houses, in which case it would be useful to sort the table. You can sort profile tables by specifying the column to sort on. Sorting is carried out on the case data in the specified column.
If you sort a table and specify a maximum number of rows, the sorting is carried out first. The following script uses the same table specification in
Limiting the number of rows displayed, but sorts the table by the number of rooms in the house:
Set Table = TableDoc.Tables.AddNewProfile("Table6", "profile({housetype, numrooms, pets})",
"House type and number of rooms of pet owners, first five, sorted")
Table.Filters.AddNew("WithPets", "pets > 0", "Has one or more pets")
Table.Properties["MaxRows"] = 5
Table.SortColumn = "profile{numrooms}"
Table.SortColumn.Order = 0 ' 0 = oAscending
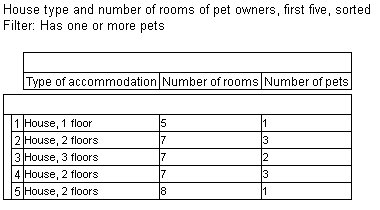
The resulting table again has five rows, but displays different results because of the sorting:
This table is sorted in ascending order using the syntax Table.SortColumn.Order = 0, however, you can also sort in descending order (descending order is the default, so in that case you would not need to specify the sort order).
See also

