Creating built-in base elements
Base elements typically show the total number of cases in an axis and are used in the calculation of percentages and statistical tests. The Table Object Model automatically adds a base element (sometimes called an
autobase) to every axis that does not already have a base element. The axis would already have a base element if one was specified in the axis specification or if the variable on which it is based contains a
built-in base element. A built-in base is a base that is defined as an element in the variable on which the axis is based (rather than in the axis specification). For more information, see
Base element.
Typically, you create a built-in base element when you want the base element to be filtered--for example, because you want to exclude from the base cases that are in a “Not answered” or “Don't know” category. This topic explains how to create a built-in base element (both filtered and unfiltered) in a derived variable and provides examples that show how a built-in base element differs from an autobase.
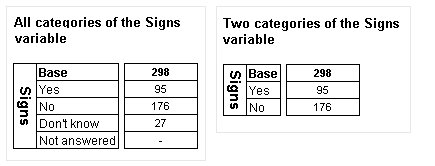
The autobase shows the total number of cases in all of the categories in the variable on which the axis is based. For example, the following script creates two one-dimensional tables from the Signs variable in the Museum sample data set. The first table includes all of the categories in the variable and the second includes the Yes and No categories only.
With TableDoc.Tables
.AddNew("Table1", "Signs", _
"All categories of the Signs variable")
.AddNew("Table2", "Signs{Yes, No}", _
"Two categories of the Signs variable")
End With
Here are the two tables, shown side by side:
The two Base rows (formed from the autobases) show the same value, because the autobase shows the total number of cases in the variable on which the axis is based, regardless of which categories are actually shown on the table. This is because the base is used to calculate percentages, and it is normal to base percentages on the number of respondents who were asked the question (which typically corresponds to the number of cases in the variable), rather than on the number of people who selected the categories that are shown on the table.
You might want to base the percentages on the cases in the categories shown on the table only. To do this, filter the table to exclude the cases that are in the categories that are not shown on the table: see
Base element. Alternatively, you can create a derived variable that has only the required categories and use this in the table instead of the original variable. The autobase will then show the number of cases in the categories included in the derived variable.
You can create the derived variable in the Metadata section of a data management script like this:
' Create a derived variable based on two categories of
' the Signs variable
Signs2 "Thinks signs could be improved"
categorical
{
Yes expression("signs * {Yes}"),
No expression("signs * {No}")
};
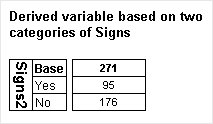
Now create a one-dimensional table for this derived variable. For example:
TableDoc.Tables.AddNew("Table3", "Signs2", _
"Derived variable based on two categories of Signs")
Here is the table:
The Base row in this table is again an autobase because the derived variable does not have a built-in base element. The base in this table shows the total number of cases in the Yes and No categories and does not include the cases in the Don't know category. This is because the axis is based on the derived variable and the derived variable does not have the Don't know category.
Now create the derived variable again, but this time with a built-in base element. For example:
' Create a derived variable based on two categories of the Signs variable
' and include a built-in base element.
Signs3 "Thinks signs could be improved with built-in base"
categorical
{Base "Base" elementtype(AnalysisBase)
expression("@ > {}"),
Yes "Yes",
No "No"
}expression("signs * {Yes, No}");
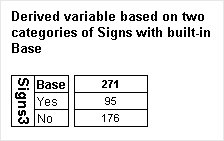
An expression is used to define the categories that are to contribute to the base. In this example, the expression for the base specifies the Yes and No categories of the Signs variable. Here is a one-dimensional table created from this derived variable:
The base in this table is exactly the same as the autobase created for the previous table. This is what you might expect because the expression that defines the base specifies the same categories as are included in the variable. This is an unfiltered built-in base and it is the same as the autobase.
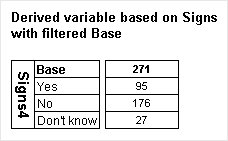
Now suppose you want to include the Don't know category in the table but exclude it from the base. You can achieve this by creating a derived variable that includes the Don't know category and a built-in base, but excluding the Don't know category from the base element's expression. This is sometimes called a filtered base. For example:
' Create a derived variable based on three categories of the Signs variable
' and include a built-in base element that is filtered to exclude the Don't
' know category.
Signs4 "Thinks signs could be improved with built-in filtered base"
categorical
{Base "Base" elementtype(AnalysisBase)
expression("@ * {Yes, No}"),
Yes "Yes",
No "No",
Dont_know "Don't know"
}expression("signs");
Here is the table:
Although the Don't know category is now shown on the table, the Base row does not include the cases in the Don't know category.
For more information, see
Base element.
The examples in this topic are in a file called
TablesFilteredBase.dms that comes with the UNICOM Intelligence Developer Documentation Library. For more information, see
Table scripting sample Data Management scripts.
See


