Understanding axes
Sample script file: UnderstandingAxes.mrs
The examples in this topic are based on the Museum sample data set. For information on running the example scripts, see
Running the sample table scripts.
Suppose you use a script similar to the following to create a table of age by gender:
TableDoc.Tables.AddNew("MyTable", "age * gender", "Age by Gender")
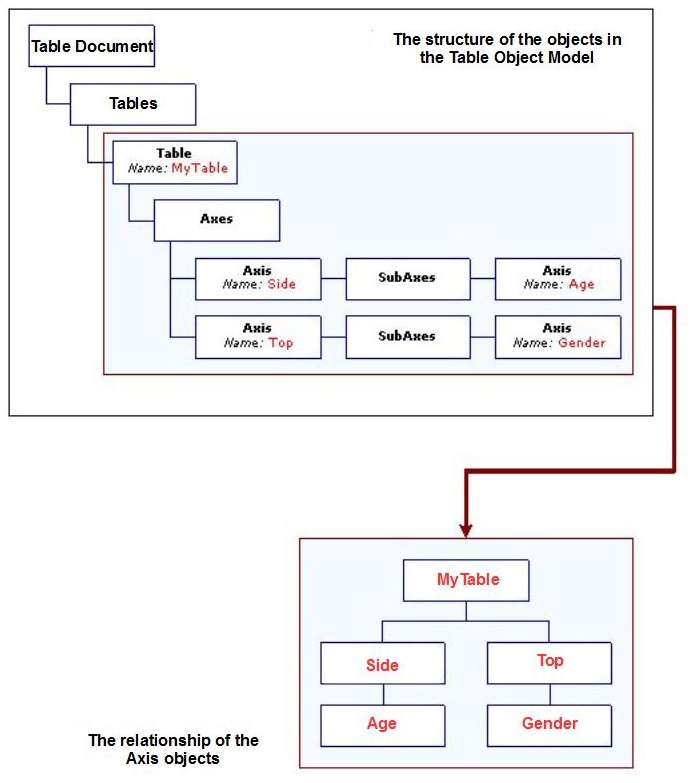
When you run the script, the Table Object Model automatically creates two Axis objects called Side and Top in the Table.Axes collection. Each Axis object in this collection defines a dimension of the table and is sometimes called a root-level axis. The Table Object Model currently supports a maximum of two root-level axes and their names must always be Side and Top.
The Table Object Model also creates an Axis object in the SubAxes collection in each of the Side and Top Axis objects. The names of these subaxes are based on the variable names that are used in the table specification.
Graphical representation of axes in object model and in table
The following diagram shows the structure of the objects in the object model and the relationship of the axes to one another in the table.
To understand why the Table Object Model creates the root-level Side and Top axes, consider a more complex table. Suppose you use the following script to create a table that has two variables (age and gender) concatenated on the side and one variable nested within another on the top (interview within before):
TableDoc.Tables.AddNew("Table2", "age + gender * before > interview", _
"Concatenation on side and nesting on top")
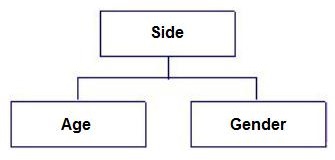
First look at the structure of the side Axis objects (where age and gender are concatenated):
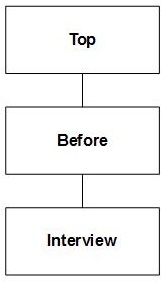
The Table Object Model has created a root-level Axis object called Side again. However, this time it has created two subaxes within it. The subaxes are at the same level, just as the variables are on the table. The root-level axis provides a convenient way of referring to the two axes concatenated together. Without the root-level axis, this would not be possible. Now look at the top Axis objects:
The relationship of the Axis objects reflects the nesting you defined. The Table Object Model has created the interview Axis as a child of the before Axis, which is in turn a child of the root-level Top Axis.
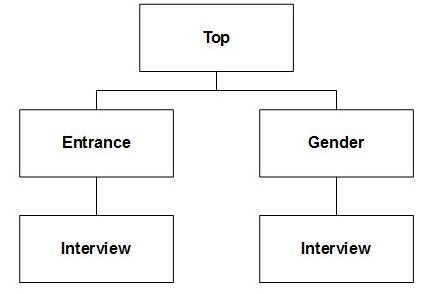
Generally, axis objects form a tree structure with a single root node. Every node in the tree is an Axis object and, with the exception of the root node, each Axis object is associated with a variable. The following example creates a table in which the top axis of the table is formed by nesting the interview variable in both the entrance and gender variables.
TableDoc.Tables.AddNew("Table3", "age * (entrance + gender) _
> interview", "Balanced tree")
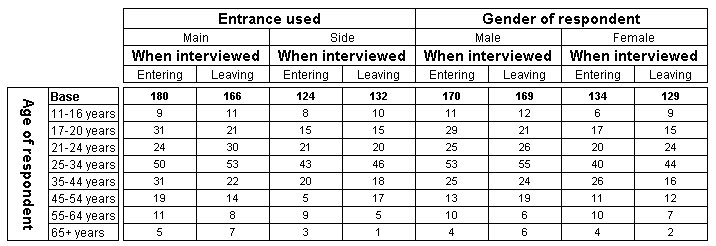
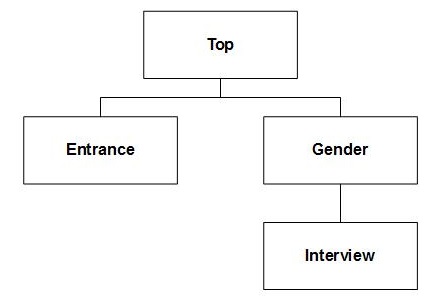
The following diagram shows the axis structure, which is an example of what is sometimes referred to as a “balanced tree”, because it leads to a balanced axis structure:
Here is the table (with the base elements in the top axis hidden to aid clarity).
You are not forced to create a balanced tree structure. The following example creates a table in which the top axis of the table is formed by nesting the interview variable within the gender variable, but not the entrance variable.
TableDoc.Tables.AddNew("Table4", "age * entrance + gender > _
interview", "Unbalanced tree")
The following diagram shows the axis structure, which is an example of what is sometimes referred to as an “unbalanced tree”:
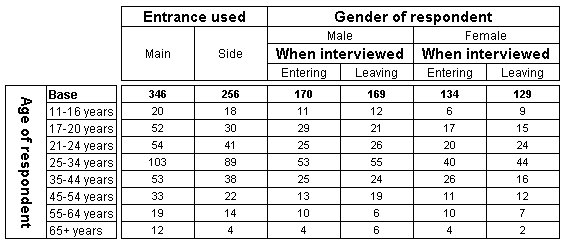
Here is the table (with the base elements in the top axis hidden to aid clarity).
The structure of an axis can be extended indefinitely. However, the resulting tables can quickly become very large and complex. The following example creates a complex unbalanced tree structure on the top axis of the table:
TableDoc.Tables.AddNew("Table5", "age * entrance + gender > _
(interview + before{.., ^Not_answered} > biology{.., ^Not_answered})", _
"Complex unbalanced tree")
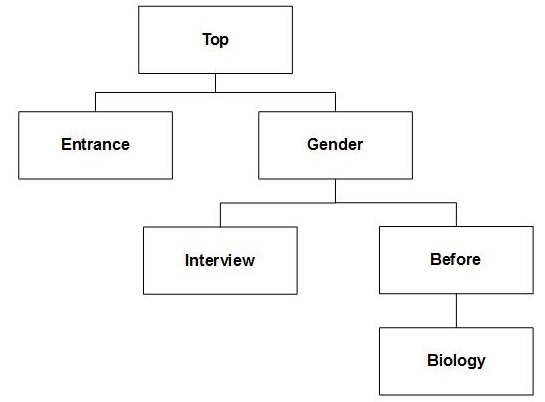
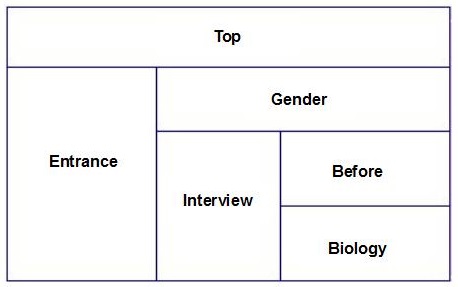
The specification is evaluated from left to right, but the nesting symbol (>) is evaluated before the concatenation symbol (+). Parentheses have been used to override the default order of precedence. The following diagram shows the axis structure:
The following diagram shows the structure of the overall axis on the table:
You can find out the number of child subaxes that belong to an axis or subaxis using the Axis.SubAxes.Count property and you can return the child Axis objects themselves using the Axis.SubAxes.Item property.
The following script demonstrates how these properties work. The script loops through the axes and subaxes on each table, writing their names and subaxis count to a text file:
Dim fso, txtfile, MyTable, MyAxis, MySubAxis, i, j, MyText
Set fso = CreateObject("Scripting.FileSystemObject")
Set txtfile = fso.CreateTextFile("UnderstandingAxes.txt", True)
For Each MyTable in TableDoc.Tables
txtfile.WriteLine()
txtfile.WriteLine(MyTable.Name)
For Each MyAxis In MyTable.Axes
ListAxes(MyAxis, txtfile)
Next
Next
Sub ListAxes(MyAxis, txtfile)
Dim MyText, MySubAxis
MyText = MyAxis.Name + " - subaxis count: " + CText(MyAxis.SubAxes.Count)
txtfile.WriteLine(MyText)
For Each MySubAxis in MyAxis.SubAxes
ListAxes(MySubAxis, txtfile)
Next
End Sub
txtfile.Close()
Run this script for the tables you created earlier. It produces the following output:
Table1
Side - subaxis count: 1
age - subaxis count: 0
Top - subaxis count: 1
gender - subaxis count: 0
Table2
Side - subaxis count: 2
age - subaxis count: 0
gender - subaxis count: 0
Top - subaxis count: 1
before - subaxis count: 1
interview - subaxis count: 0
Table3
Side - subaxis count: 1
age - subaxis count: 0
Top - subaxis count: 2
entrance - subaxis count: 1
interview - subaxis count: 0
gender - subaxis count: 1
interview - subaxis count: 0
Table4
Side - subaxis count: 1
age - subaxis count: 0
Top - subaxis count: 2
entrance - subaxis count: 0
gender - subaxis count: 1
interview - subaxis count: 0
Table5
Side - subaxis count: 1
age - subaxis count: 0
Top - subaxis count: 2
entrance - subaxis count: 0
gender - subaxis count: 2
interview - subaxis count: 0
before - subaxis count: 1
biology - subaxis count: 0
See also
