Examples
Sample script file: CellContents.mrs
This example script is based on the Museum sample data set. For information on running the example scripts, see
Running the sample table scripts.
This topic provides examples of using various different types of cell contents. All of the tables in the examples use the same two variables from the Museum sample (biology on the top and expect on the side).
Counts and unweighted counts
Counts show the number of cases that satisfy the row and column conditions for each cell after any weighting defined for the table has been applied. Counts are the basic values that are shown in the cells of a table. Unweighted counts show the number of cases that satisfy the row and column conditions for each cell before any weighting defined for the table has been applied. In an unweighted table, the counts and unweighted counts are identical.
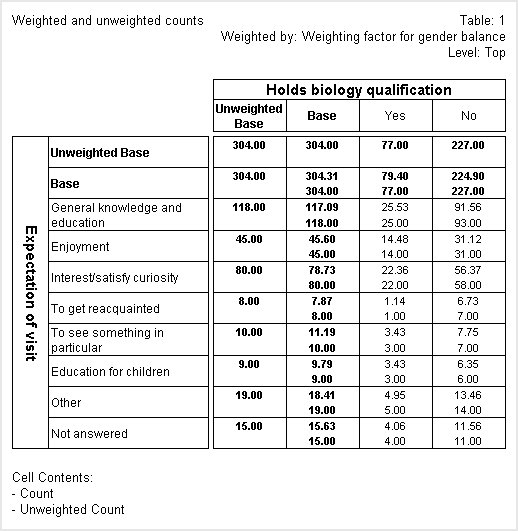
The following table shows both weighted and unweighted counts in all of the cells apart from those formed from the unweighted base elements. By default, an unweighted base element is added to all weighted tables. For more information, see
Base element.
In this table, both the weighted and unweighted counts are shown with two decimal places. The table is weighted using the genbalance weighting variable, which uses non-integer sample weights to weight the sample to an equal balance between the two genders. More males than females were interviewed in the survey, so the genbalance weighting variable inflates the responses from female respondents and deflates the responses from male respondents.
If you look at the unweighted counts in the
Enjoyment row, you can see that of the people who selected this category, 14 have a biology qualification and 31 don't. The unweighted counts are always whole numbers because a respondent either does or does not select each category. If you look at the weighted counts in the same row, you can see that the figures are 14.48 and 31.12, respectively. The weighted counts are non-integers because they represent the unweighted counts multiplied by the appropriate weights, which in this example are non-integer values. For more information, see
Weighting.
In practice, counts are generally shown as whole numbers, as shown in the following example.
Percentages
Percentages express the count or sum of a numeric variable as a percentage of the base for the column, row, or table. Expressing figures as percentages can make it easier to interpret and compare the data in a table. The following table shows both counts and column percentages.
In this table, the first figure in each cell is the count and the second is the column percentage. The count in the Base column of the Base row shows that 304 respondents were asked both of the questions that the variables in the table are based on. These respondents form the sample base for the table.
The counts in the first row after the Base row show that 118 people described their expectation as General knowledge and education, and of these people, 25 hold a biology qualification and 93 do not. The column percentages show that 39% of the respondents in the table describe their expectation as General knowledge and education. A higher percentage of those who do not have a biology qualification (41%) expected to gain general knowledge than those with such a qualification (32%).
Sometimes, rounding means that the percentages for single response variables do not always add up to 100%. For example, the percentages in the
No column in the preceding table add up to 101%. This is because UNICOM Intelligence Professional performs all calculations using the maximum possible accuracy and performs rounding only immediately before it displays figures in a table. For more information, see
Rounding.
You can use the
AdjustRounding table property (see
Table properties) to specify that the rounding should be adjusted so that the percentages add up to 100%.
Here is the table after the rounding has been adjusted. The percentages in the No column now add up to 100%:
The biology and expect variables are both single response variables. In multiple response variables, percentages do not usually add up to 100% and adjusting the figures to do so would not make sense.
In the following table, the column percentages are shown as cumulative percentages.
The column percentages are shown with two decimal places. In all other respects, the column percentages in the first row after the Base row are the same as those shown in the column percentages table shown earlier. However, the percentages in the subsequent rows differ. This is because the column percentages for each successive row are added to those of the previous rows to make a cumulative percentage, so the cumulative percentage for the final row is 100%.
The column percentages are not shown in the
Base row. This has been achieved by setting the
Show100Percent table property (see
Table properties to False.
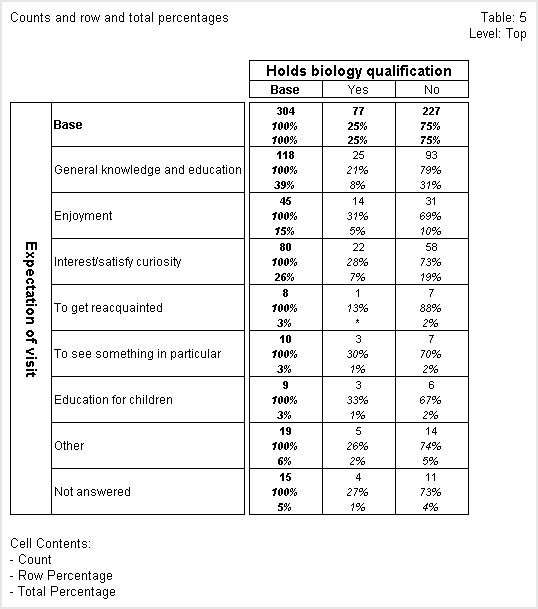
The following table shows counts, and row and total percentages.
In this table the first figure in each cell is the count, the second is the row percentage, and the third is the total percentage. Row percentages show us what percentage of the respondents in each row fall in each column. For example, if you look at the General knowledge and education row, you can see that 21% of the respondents in the row hold a biology qualification, whereas 79% of them do not.
Similarly, total percentages show us what percentage of the total number of respondents in the table fall in each cell of the table. Looking at the General knowledge and education row again, you can see that respondents in the row who hold a biology qualification make up 8% of the respondents in the table and those in the same row without a biology qualification make up 31% of the total for the table.
You can remove the percent signs from all cells in a table (for example, in tables that contain only percentage values) by setting the
ShowPercentSigns table property (see
Table properties) to False.
Indices
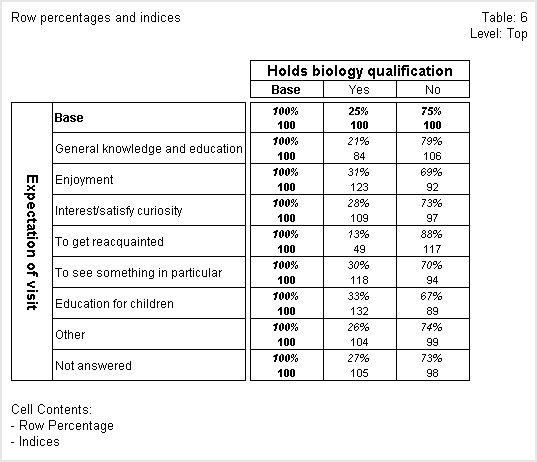
Indices are calculated for each cell by dividing the row percentage in the cell by the row percentage for the same column in the base row. Indices show how closely row percentages in a row reflect the row percentages in the base row. The nearer a row's indices are to 100%, the more closely that row mirrors the base row. The following table shows row percentages and indices.
The indices in the Other row are closest to 100%. In the No column, the index of 99 was created by dividing the row percentage of 74% by 75%, the row percentage for the No cell in the Base row. The row percentages in the Other row are 26% and 74%, which closely matches the row percentages of 25% and 75% in the Base row.
Summary statistics of numeric variables
You can show summary statistics of numeric variables for the cases in the cells of a table. For example, you can show the total number of previous visits made to the museum by the respondents in each cell by using the Sum cell contents option and the visits variable. Similarly, you can use the Mean cell contents option to show the average number of previous visits made by the respondents in each cell.
In weighted tables, all of the summary statistics apart from the minimum and maximum values are weighted. If you want to show unweighted summary statistics, do not weight the table.
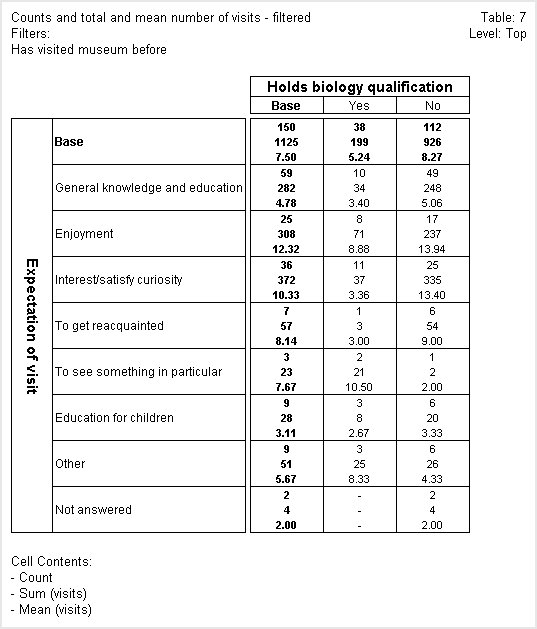
In the following table, the first figure in each cell is the count, the second is the sum of the visits numeric variable, and the third is the mean value of the visits numeric variable.
When UNICOM Intelligence Professional calculates counts in a unweighted table, it increments the count in each cell by one each time it finds a case that satisfies the conditions that define the cell. In this table, the count for the Yes cell of the General knowledge and education row has a value of 10 because there were 10 respondents who chose both the Yes category of the biology question and the General knowledge and education category of the expect question, and who pass the filter on the table.
When you choose to base cell contents on the sum of a numeric variable, instead of incrementing each cell by one when it finds a case that satisfies the cell conditions, UNICOM Intelligence Professional increments the cell by the value held in the numeric variable for that case. The Yes cell of the General knowledge and education row shows that the 10 respondents in the cell made a total of 34 previous visits to the museum.
The mean shows the mean value of that variable for the respondents in the cell. The mean in the same cell is 3.40, which is what you get when you divide the total number of visits (34) by the number of respondents (10).
The example table is filtered to exclude respondents for whom the visits variable stores a Null value. This is a special value that indicates that the respondent didn't answer the question on which the visits variable is based.
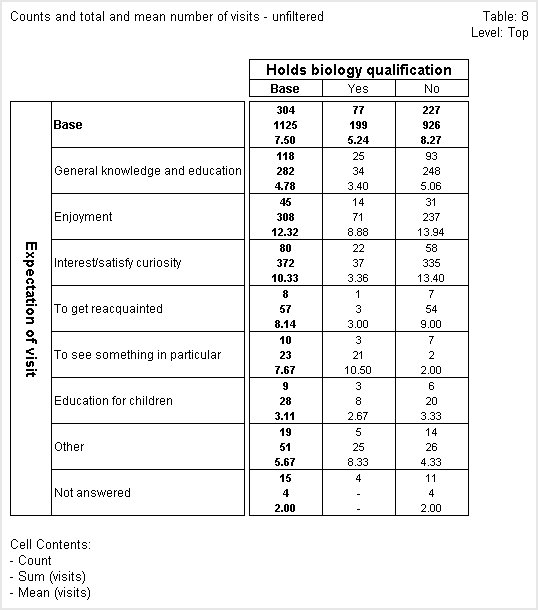
The following table is unfiltered. The Yes cell of the General knowledge and education row shows that the mean is shown as 3.40. The number of visits is still 34, but there are now 25 respondents in the cell, so the mean appears to be incorrect. This is because UNICOM Intelligence Reporter - Survey Tabulation calculates the means by dividing the sum by the number of respondents in the cell who answered the question on which the numeric variable is based, and not by the total number of respondents in the cell. In this cell, as in most cells in the unfiltered table, these two values are different.
Expected values and residuals
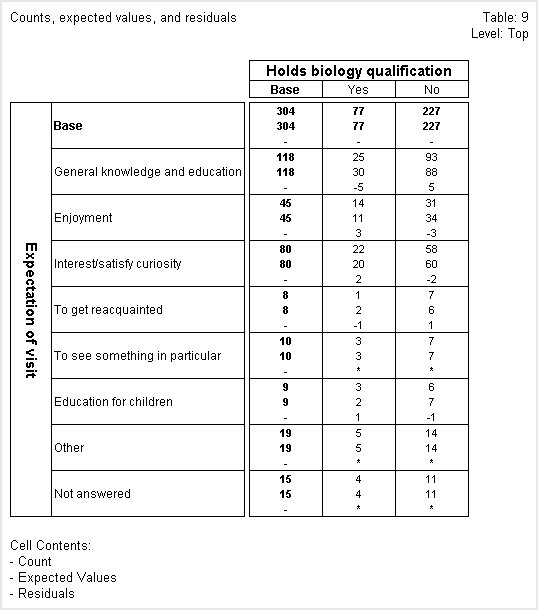
Expected values show the count or sum of a numeric variable that would be expected in the cell if the row and column variables were statistically independent or unrelated to each other. Residuals show the difference between the count or sum of a numeric variable and the expected values. Large absolute values for the residuals indicate that the observed values are very different from the predicted values.
In the following table, the first figure in each cell is the count, the second is the expected value, and the third is the residual.
The General knowledge and education shows the biggest discrepancy between the actual counts and the expected values in both the Yes and No columns. However, the actual count is less than the expected value in the Yes column and this is reflected in the negative residual value and the actual count is greater than the expected value in the No column and this is reflected in the positive residual value.
Script used to create the example tables:
' User-defined constants to represent the cell item types
Const itCount = &H0000
Const itColPercent = &H0001
Const itRowPercent = &H0002
Const itTotalPercent = &H0003
Const itMean = &H0004
Const itSum = &H0005
Const itMinimum = &H0006
Const itMaximum = &H0007
Const itUnweightedCount = &H0008
Const itCumColPercent = &H0009
Const itCumRowPercent = &H000A
Const itRange = &H000B
Const itMode = &H000C
Const itMedian = &H000D
Const itPercentile = &H000E
Const itStdDev = &H000F
Const itStdErr = &H0010
Const itVariance = &H0011
Const itResiduals = &H0012
Const itExpectedValues = &H0014
Const itIndices = &H0016
Dim TableDoc
' Create the Table Document object
Set TableDoc = CreateObject("TOM.Document")
' Load the Museum sample XML data set
' Load the Museum sample XML data set
TableDoc.DataSet.Load(" [INSTALL_FOLDER]\IBM\SPSS\DataCollection\7\DDL\Data\Xml\museum.mdd", _
, " [INSTALL_FOLDER]\IBM\SPSS\DataCollection\7\DDL\Data\Xml\museum.xml", _
"mrXmlDsc")
' Clear the default cell contents
TableDoc.Default.CellItems.Clear()
' Change the Expect variable's description
TableDoc.DataSet.MDMDocument.Fields["expect"].Label = "Expectation of visit"
With TableDoc.Tables
.AddNew("Table1", "expect * biology{Yes, No}", _
"Weighted and unweighted counts")
.Table1.CellItems.AddNew(itCount, 2)
.Table1.CellItems.AddNew(itUnweightedCount, 2)
.Table1.Weight = "GenBalance"
.AddNew("Table2", "expect * biology{Yes, No}", _
"Counts and column percentages")
.Table2.CellItems.AddNew(itCount)
.Table2.CellItems.AddNew(itColPercent)
.AddNew("Table3", "expect * biology{Yes, No}", _
"Counts and column percentages - rounding adjusted")
.Table3.CellItems.AddNew(itCount)
.Table3.CellItems.AddNew(itColPercent)
.Table3.Properties["AdjustRounding"] = True
.AddNew("Table4", "expect * biology{Yes, No}", _
"Counts and cumulative column percentages")
.Table4.CellItems.AddNew(itCount)
.Table4.CellItems.AddNew(itCumColPercent, 2)
.Table4.Properties["Show100Percent"] = False
.AddNew("Table5", "expect * biology{Yes, No}", _
"Counts and row and total percentages")
.Table5.CellItems.AddNew(itCount)
.Table5.CellItems.AddNew(itRowPercent)
.Table5.CellItems.AddNew(itTotalPercent)
.AddNew("Table6", "expect * biology{Yes, No}", _
"Row percentages and indices")
.Table6.CellItems.AddNew(itRowPercent)
.Table6.CellItems.AddNew(itIndices)
.AddNew("Table7", "expect * biology{Yes, No}", _
"Counts and total and mean number of visits - filtered")
.Table7.CellItems.AddNew(itCount)
.Table7.CellItems.AddNew(itSum, 0, "visits")
.Table7.CellItems.AddNew(itMean, 2, "visits")
.Table7.Filters.AddNew("VisitedMuseumBefore", _
"visits IS NOT NULL", "Has visited museum before")
.AddNew("Table8", "expect * biology{Yes, No}", _
"Counts and total and mean number of visits - unfiltered")
.Table8.CellItems.AddNew(itCount)
.Table8.CellItems.AddNew(itSum, 0, "visits")
.Table8.CellItems.AddNew(itMean, 2, "visits")
.AddNew("Table9", "expect * biology{Yes, No}", _
"Counts, expected values, and residuals")
.Table9.CellItems.AddNew(itCount)
.Table9.CellItems.AddNew(itExpectedValues)
.Table9.CellItems.AddNew(itResiduals)
End With
' Populate the tables
TableDoc.Populate()
' Export the tables
With TableDoc.Exports.mrHtmlExport
.Properties["Interactive"] = True
.Properties["LaunchApplication"] = True
.Export("CellContents.htm")
End With
See also
