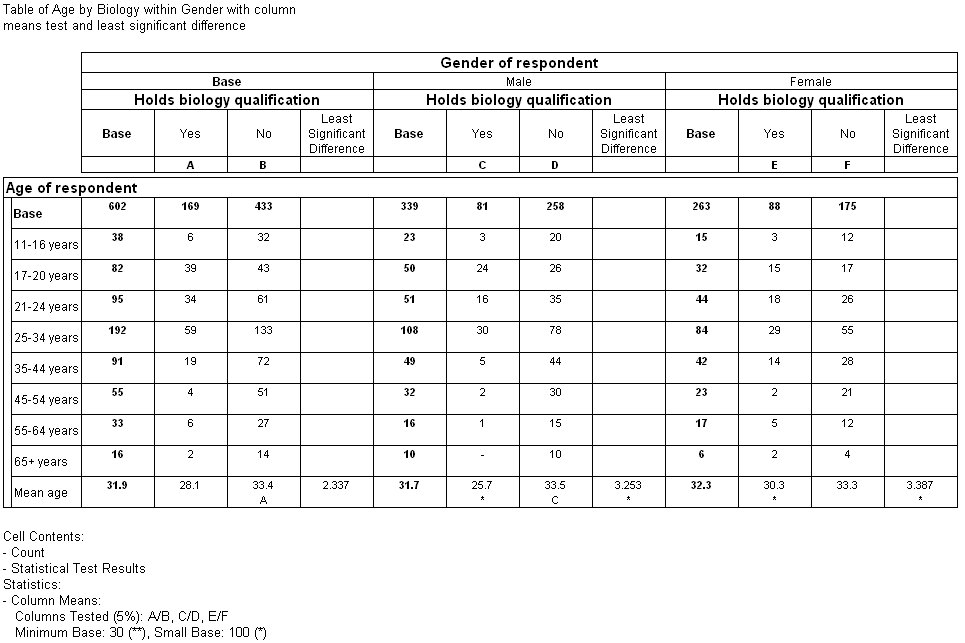
Example showing the least significant difference column
Sample script file: QuanvertTables.mrs
This example script is based on the Museum sample data set. See
Running the sample table scripts for information on running the example scripts.
This example is based on the first table in
Examples of the column means test. The column means test is run on the same table specification with the same significance level. In addition, a least significant difference column is added to the table. The script to add the column is as follows:
TableDoc.Table8.Statistics.ColumnMeans.Properties["ShowLSD"] = True
Here is the table:
An additional column has been added in each section of the table. In the Mean age row, the column contains the lowest value that would be required for the difference between columns to be significant. For example, in the Female section of the table, the columns (E and F) are not marked as significantly different. The difference between the two columns E and F is 3.0. The least significant difference value for this section shows that, in order to be significant, the columns in this section would need to differ by at least 3.387.
TableDoc.Table8.Statistics.ColumnMeans.Properties["ShowLSD"] = True
Here is the table:
An extra column has been added in each section of the table. In the Mean age row, the column contains the lowest value that would be required for the difference between columns to be significant. For example, in the Female section of the table, the columns (E and F) are not marked as significantly different. The difference between the two columns E and F is 3.0. The least significant difference value for this section shows that, in order to be significant, the columns in this section would need to differ by at least 3.387.
See also


