Desktop User Guides > Professional > Table scripting > Statistical tests > Net difference test > Statistical formula for the net difference test
 
Statistical formula for the net difference test
The following table shows the formulae used for conducting the net difference test in UNICOM Intelligence Professional.
Formula for proportions
For any row, and any of the four columns being tested (i=1,2,3, and 4):
Notation
Description
W i
Sum of the weights (weighted base) for column i.
Q i
Sum of the squared weights for column i.
E i = (W i * W i) / Q i
Effective base for column i.
P i
Proportion in column i
For a table with overlap or a grid table, and any pair of columns from the four being tested (i and j=1,2,3, and 4):
Notation
Description
W ij
Sum of the weights (weighted base) for respondents in both columns.
Q ij
Sum of the squared weights for respondents in both columns.
E ij = (W ij * W ij) / Q ij
Effective base for respondents in both columns.
P ij
Proportion for respondents belonging in the row being tested for both columns.
The formula is:
This graphic is described in the surrounding text.
where
numer = (P 3 - P 4) - (P 1 - P 2)
and for a non-grid, non-overlap table
This graphic is described in the surrounding text.
For a table with overlap or a grid table
This graphic is described in the surrounding text.
where
This graphic is described in the surrounding text.
The degrees of freedom are:
This graphic is described in the surrounding text.
where, for a non-grid, non-overlap table
This graphic is described in the surrounding text.
and
This graphic is described in the surrounding text.
For a table with overlap or a grid table
This graphic is described in the surrounding text.
and
This graphic is described in the surrounding text.
Formula for means
For any row, and any of the four columns being tested (i=1,2,3, and 4):
Notation
Description
W i
Sum of the weighted base for column i.
Q i
Sum of the squared weights for column i.
E i = (W i * W i) / Q i
Effective base for column i.
X i
sum of values for column i
Y i
sum of squared values for column i
M i
mean for column i=X i/W i
The values can be either numeric values or factor values.
For a table with overlap or a grid table, and any pair of columns from the four being tested (i and j=1,2,3, and 4):
Notation
Description
W ij
Sum of the weighted base for respondents in both columns.
Q ij
Sum of the squared weights for respondents in both columns.
E ij = (W ij * W ij) / Q ij
Effective base for respondents in both columns.
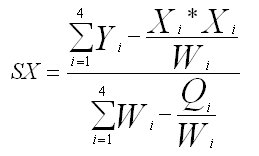
The intermediate term SX is:
This graphic is described in the surrounding text.
The tstat is
This graphic is described in the surrounding text.
where
numer = (M 3 - M 4) - (M 1 - M 2)
and for a grid, non-overlap table,
This graphic is described in the surrounding text.
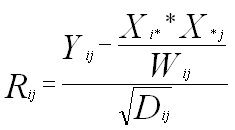
For a table with overlap or a grid table
This graphic is described in the surrounding text.
where
This graphic is described in the surrounding text.
For a non-grid table with overlap, R ij reduces to 1.
Grid tables
For a grid table, it is not possible to display the net difference if the mean is a numeric mean rather than a factor mean. In this case, an error is returned.
For a grid table with factor means:
Notation
Description
X i*
The weighted sum of factors for column i for all respondents belonging in the mean for column i and in the base of column j.
X *j
The weighted sum of factors for column j for all respondents belonging in the mean for column j and in the base of column i.
Y i*
The weighted sum of squared factors for column i for all respondents belonging in the mean for column i and in the base of column j
Y *j
The weighted sum of squared factors for column j for all respondents belonging in the mean for column j and in the base of column i
Y ij
The weighted sum of (factor for column i) * (factor for column j) for all respondents belonging in the mean for both columns.
Using the preceding terms:
This graphic is described in the surrounding text.
where:
This graphic is described in the surrounding text.
Degrees of freedom
The degrees of freedom are:
This graphic is described in the surrounding text.
where, for a non-grid, non-overlap table:
This graphic is described in the surrounding text.
and
This graphic is described in the surrounding text.
For a table with overlap or a grid table:
This graphic is described in the surrounding text.
and
This graphic is described in the surrounding text.
For more on the theory of overlapping samples, see Kish, L (1965), Survey Sampling, New York: John Wiley and Sons. ISBN 0-471-48900-X.
See also
Net difference test