Adding a minimum p value to a table
Sample script file: ColumnProportionsTest.mrs
This example script is based on the Museum sample data set. See
Running the sample table scripts for information on running the example scripts.
This example creates a table with the column proportions test. The table is similar to the first example in
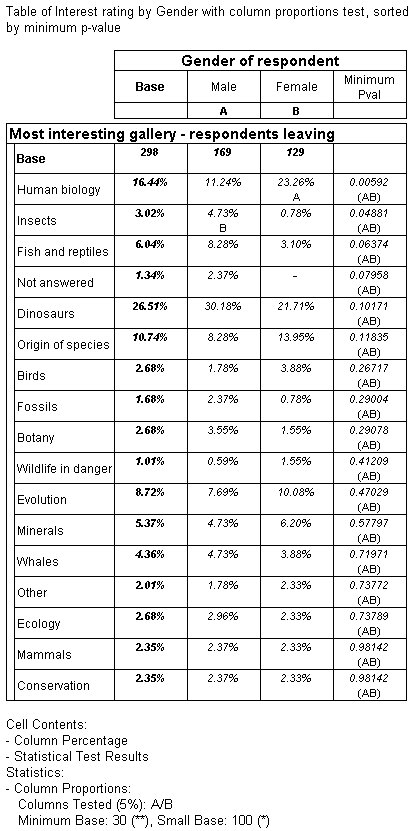
Examples of the column proportions test, with the addition of a column displaying the minimum
p value for each row. The rows are sorted in ascending order of the
p value.
The script adds the minimum p value column to the table and sort the rows in ascending order based on the value of that column:
TableDoc.Table6.Statistics.ShowMinPVal = True
TableDoc.Table6.SortColumn = "gender{MinPVal}"
TableDoc.Table6.SortColumn.Order = 0
Here is the resulting table:
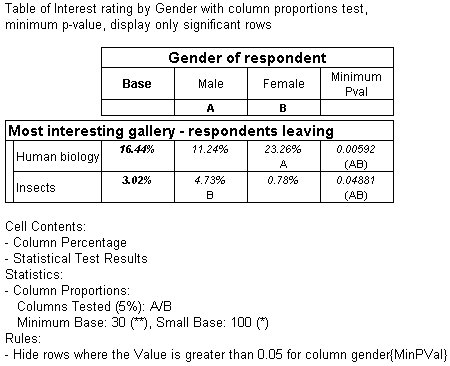
The following example shows a table with a similar specification, but in addition, rows where the p value is greater than 0.05 have been hidden.
This is the script to hide the rows:
Set R = TableDoc.Table7.Rules.AddNew()
R.Type = 0 ' hide
R.Target = 0 ' row
R.CellItemRef = 0 ' if cellitem 0 (counts)
R.Operator = 4 ' is greater than
R.Value = 0.05 ' 0.05
R.ElementRef = "gender{MinPVal}" ' for MinPVal column
R.IgnoreSpecialElements = False ' hide specials as well
Here is the resulting table:
Only two rows are displayed, as these are the only rows where the results are significant at a p value of 0.05 or less. This corresponds to the 5 percent significance level selected for the test for this table.
See also


