Creating profile tables
Sample script file: ProfileTables.mrs
This example script is based on the Household sample data set. See
Running the sample table scripts for more information.
The process for creating profile tables is similar to that for creating aggregated tables, but instead of using the AddNew method, you use the AddNewProfile method and use the syntax "profile({variable})" to specify the profile as an axis with the variables as elements. For example, here is a script to create a profile table for the address variable:
Set Table = TableDoc.Tables.AddNewProfile("Table1", _ "profile({address})", _
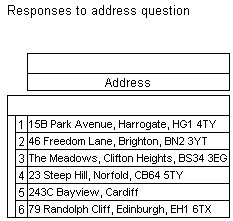
"Responses to address question")
The resulting table shows the individual responses to the question.
You can display multiple variables in a profile. This script creates a profile table for the address and numpersons variables:
Set Table = TableDoc.Tables.AddNewProfile("Table2", _
"profile({address, numpersons})",
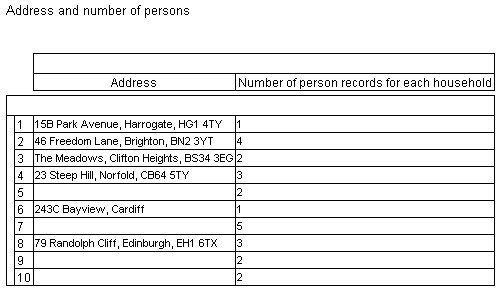
"Address and number of persons")
The resulting table shows the individual responses to the two questions:
There are more rows in the second table. By default, rows that contain no data for all of the selected variables are automatically removed. As the address question was not answered by all respondents, rows with no answer for this question are not displayed in the first table.
See also


