Creating axis expressions in your script
Sample Script Files: AutoSummarizeNumerics.mrs, AutoSummarizeNumericsAndSave.mrs
The
AutoSummarizeNumerics.mrs example script is based on the Museum sample data set. The
AutoSummarizeNumericsAndSave.mrs example script is based on the Short Drinks sample data set. To run examples using the Short drinks sample data set, you need access to a SQL Server installation on which the Short Drinks sample database has been restored, and appropriate user access rights. For more information, see
Restoring the Short Drinks sample database. See also
Running the sample table scripts for information on running the example scripts.
You can include code in your mrScriptBasic table script to set up axis expressions for some of your variables. This method is particularly suitable when you want to use a standard axis expression for a number of variables. The following script is an example of setting up standard axis expressions for summarizing all of the numeric variables in a data set. The script also creates a simple one-dimensional table for each of the numeric variables using the axis expressions.
' Create tables for all numeric variables
MakeTablesFromNumerics(TableDoc, TableDoc.DataSet.MDMDocument.Fields)
Sub MakeTablesFromNumerics(TableDoc, Fields)
Dim Field
' Loop through all fields and create a one-dimensional table for all
' of the numeric variables
For Each Field In Fields
Select Case Field.ObjectTypeValue
Case 0 ' mtVariable - Simple variable
If Field.DataType = mr.Long Or Field.DataType =
mr.Double Then
' It's a numeric - autosummarize
AutoSummarizeNumeric(Field)
TableDoc.Tables.AddNew("Table" +
CText(TableDoc.Tables.Count + 1), _
Field.FullName, Field.Label)
End If
Case 1, 2, 3, 18 ' Array, Grid, Class, or Compound
' It's a container, process the contents
MakeTablesFromNumerics(TableDoc, Field.Fields)
End Select
Next
End Sub
Sub AutoSummarizeNumeric(Field)
Field.AxisExpression = "{min 'Minimum' min(" + Field.FullName + _
"), max 'Maximum' max(" + Field.FullName + _
"), mean 'Mean' mean(" + Field.FullName + _
"), StdDev 'Standard deviation' StdDev(" + Field.FullName + _
"), StdErr 'Standard error' StdErr(" + Field.FullName + ")}"
End Sub
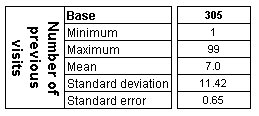
One-dimensional table with Visits on side axis. Min, max, mean, standard deviation and standard error elements have been added by the axis expression
Here is the table for the visits variable:
This technique is useful when you want to set up multiple tables using a standard axis expression. However, the axis expressions are stored in the metadata only while you run the script, because the Table Object Model opens the metadata in no-save mode, which means that the changes you make are not preserved after the script has finished running.
If you want to preserve the axis expressions, you need to open the metadata in read-write mode, write the axis expressions, and then save the metadata. If you want to do this in the same .mrs file that you use to set up the tables, you would typically do it before calling the Table Object Model Document.Load method. For example:
Dim MDM
' Create the MDM object and open all versions of the
' short_drinks.mdd file in read-write mode
Set MDM = CreateObject("MDM.Document")
MDM.Open(" [INSTALL_FOLDER]\IBM\SPSS\DataCollection\7\DDL\Data\mdd\short_drinks.mdd", "{..}")
' Set up axis expressions for all numeric variables
' that don't already have one
CreateAxisExpressions(MDM.Fields)
Sub CreateAxisExpressions(Fields)
Dim Field
' Loop through all fields and create an axis expression for
' all of the numeric variables
For Each Field In Fields
Select Case Field.ObjectTypeValue
Case 0 ' mtVariable - Simple variable
If Field.DataType = mr.Long Or Field.DataType = mr.Double Then
' It's a numeric
If Field.AxisExpression.IsEmpty() Then
' It hasn't already got an axis expression, so create one
Field.AxisExpression = "{min 'Minimum' min(" + Field.FullName + _
"), max 'Maximum' max(" + Field.FullName + _
"), mean 'Mean' mean(" + Field.FullName + _
"), StdDev 'Standard deviation' StdDev(" + Field.FullName + _
"), StdErr 'Standard error' StdErr(" + Field.FullName + ")}"
End If
End If
Case 1, 2, 3, 18 ' Array, Grid, Class, or Compound
' It's a container, process the contents
CreateAxisExpressions(Field.Fields)
End Select
Next
End Sub
' Save the MDM Document to a new file
MDM.Save(" [INSTALL_FOLDER]\IBM\SPSS\DataCollection\7\DDL\Output\short_drinks_new.mdd")
' Now create the Table Document object and load the metadata just saved.
.
.
.
See also

