Tables with nested variables
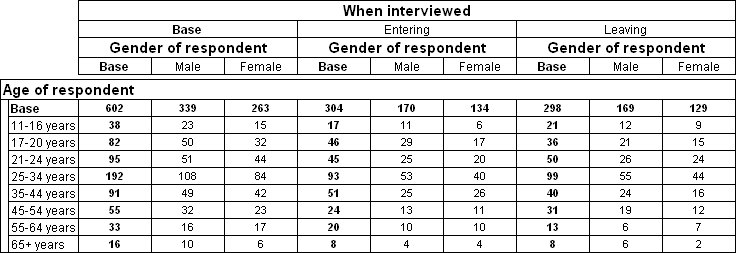
When you nest variables in a table, the elements of a nested variable are displayed for each element of the variable within which it is nested. An element that has elements of another variable nested within it is sometimes called a section. For example, in the following table, the Gender variable, which has two elements (Male and Female), is nested within the Interview variable, which also has two elements (Entering and Leaving). This table has two sections, one formed from the Entering element, the other from the Leaving element.
Table with two variables nested on the top axis
If you now nest the Before variable in the Gender variable, the table will have four sections. You can calculate the number of sections by multiplying the number of elements in the outer variable (Interview, which has two elements) by the number of elements in the variable nested in it (Gender, which also has two elements). The number of elements in the innermost nesting level is not relevant to this calculation.
UNICOM Intelligence Reporter - Survey Tabulation and UNICOM Intelligence Reporter have a built-in limit of 500 sections on the side or top axis of the table. If you create a table that exceeds this limit, you are likely to encounter “Aggregator Error 290” when you attempt to populate the table.
Only the weight in the lowest level (for the different variable elements, at different nest levels) is honored when applying weights.
See also

