Summary statistics of numeric variables
You can show summary statistics of numeric variables for the cases in the cells of a table. For example, if you create a table of age by gender using the Museum data set, you can show the total number of previous visits made to the museum by the respondents in each cell by using the Sum cell contents option and the visits variable. Similarly, you can use the Mean cell contents option to show the average number of previous visits made by the respondents in each cell.
In weighted tables, all of the summary statistics apart from the minimum and maximum values are always weighted. If you want to show unweighted summary statistics, you must remove the weighting from the table.
Summary statistics
You can use the following summary statistics for cell contents:
Mean
A measure of central tendency. It is the arithmetic average; the sum divided by the number of cases.
Sum
The sum or total of the values.
Minimum
The smallest value.
Maximum
The largest value.
Range
The difference between the largest and smallest values--the maximum minus the minimum.
Mode
The most frequently occurring value. If several values share the greatest frequency of occurrence, each of them is a mode.
Median
The value above and below which half the cases fall; the 50th percentile. If there is an even number of cases, the median is the average of the two middle cases when they are sorted in ascending or descending order. The median is a measure of central tendency not sensitive to outlying values--unlike the mean, which can be affected by one or more extremely high or low values.
Percentile
A value that divides cases according to values below which certain percentages fall. For example, the 25th percentile is the value below which 25% of cases fall.
Standard deviation
A measure of dispersion around the mean. In a normal distribution, 68% of cases fall within one standard deviation of the mean and 95% of cases fall within two standard deviations. For example, if the mean age is 45 with a standard deviation of 10, then 95% of the cases would be between 25 and 65 in a normal distribution.
Standard error
A measure of how much the value of the mean varies between samples taken from the same distribution. The standard error of the sample mean can be used to estimate a mean value for the population as a whole. In a normal distribution, 95% of the values of the mean should lie in the range of plus and minus two times the standard error from the mean. Additionally, the standard error can be used to roughly compare the observed mean to a hypothesized value of another mean (that is, you can conclude the two values are different if the ratio of the difference to the standard error is less than -2 or greater than +2).
Variance
This is the sample variance, which is a measure of dispersion around the mean, equal to the sum of squared deviations from the mean divided by one less than the number of cases. The sample variance is measured in units that are the square of those of the variable itself.
Examples
Table showing counts and total and mean number of visits
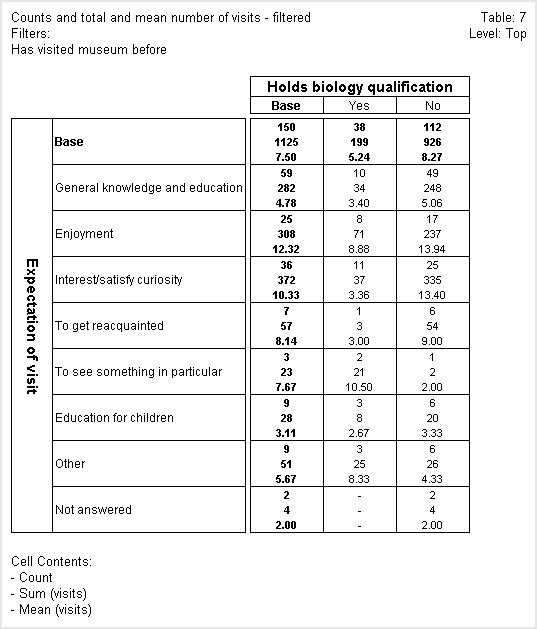
In the following table, the first figure in each cell is the count, the second is the sum of the visits numeric variable, and the third is the mean value of the visits numeric variable.
When UNICOM Intelligence Reporter calculates counts in a unweighted table, it increments the count in each cell by one each time it finds a case that satisfies the conditions that define the cell. In the preceding table, the count for the Yes cell of the General knowledge and education row has a value of 10 because there were 10 respondents who chose both the Yes category of the biology question and the General knowledge and education category of the expect question, and who pass the filter on the table.
When you choose to base cell contents on the sum of a numeric variable, instead of incrementing each cell by one when it finds a case that satisfies the cell conditions, UNICOM Intelligence Reporter increments the cell by the value held in the numeric variable for that case. If we look at the Yes cell of the General knowledge and education row again, we can see that the 10 respondents in the cell made a total of 34 previous visits to the museum.
The mean shows the mean value of that variable for the respondents in the cell. The mean in the same cell is 3.40, which is what you get when you divide the total number of visits (34) by the number of respondents (10).
The preceding table is filtered to exclude respondents who did not answer the question on which the visits variable is based.
Unfiltered table showing counts and total and mean number of visits
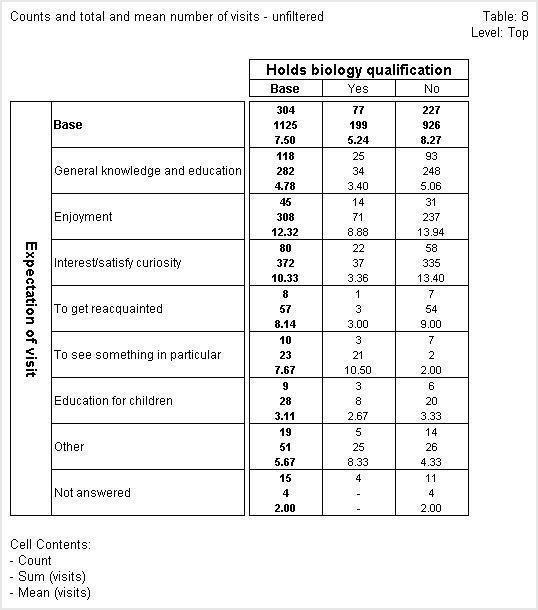
The following table is unfiltered. The Yes cell of the General knowledge and education row again shows the mean as 3.40. The number of visits is still 34, but there are now 25 respondents in the cell, so the mean appears to be incorrect. This is because UNICOM Intelligence Reporter calculates the means by dividing the sum by the number of respondents in the cell who answered the question on which the numeric variable is based, and not by the total number of respondents in the cell. In this cell, as in most cells in the unfiltered table, these two values are different.
See also


