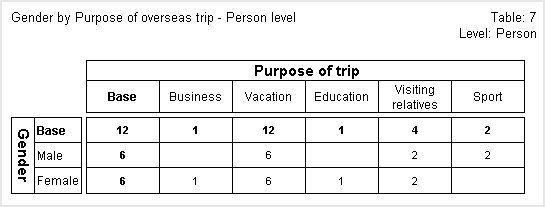
Table 7: Variables from different levels tabulated at a higher level
The following table crosstabulates the same person-level variable (gender) with the same trip-level variable (purpose). However, this time the results are generated at the person level. This means that instead of showing the number of overseas trips, each cell now shows the number of people of each gender who took trips that involved a particular purpose.
To create this table, use the same table structure as in the previous example, but this time change the level to person.
Variables from different levels tabulated at a higher level
The Base column shows that of the 12 people who took overseas trips, 6 were males and 6 were females.
The top left cell shows that the base for the table is 12, which corresponds with the base in
Table 5: Trip-level variables tabulated at the person level, which tabulates two trip-level variables at the person level. Note that the base counts every person who took one or more overseas trips. People who did not take an overseas trip are not counted in the base because the base calculation considers empty levels to be Null.
See also

