Hiding rows, columns, and cells
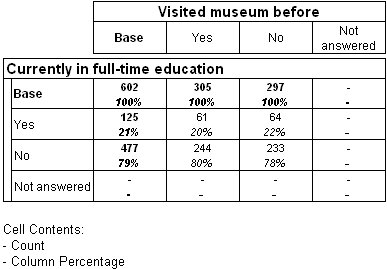
You can hide rows, columns, or cells in your tables where all values are equal to, above, or below a value that you specify. This means that you can display tables without rows or columns containing insignificant values. For example, the following table contains both a row and a column that contain only zero values:
Table containing row and column with zero values
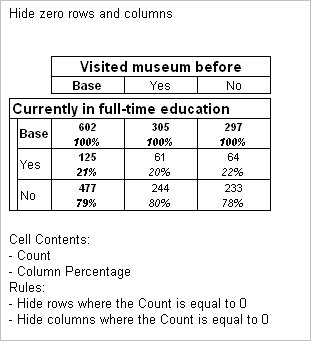
By hiding rows and columns containing only zeros, you can simplify the table and display only the information of interest:
Table with zero value row and column hidden
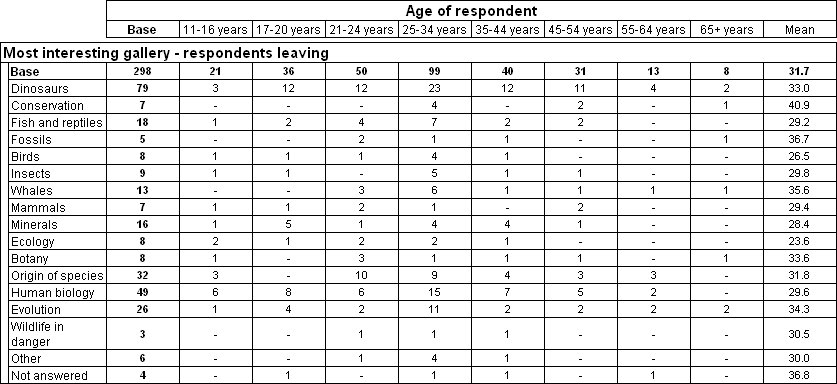
By default, all values in the first cell item in a row or column must be equal to zero for that row or column to be hidden, as in the preceding example. However, you can use the value in another row or column on the table to test the hide condition. For example, in the following table of interest by age, a column has been added to show the mean age:
Table of interest by age with added mean column
If you are interested in the results for a particular age range, you can hide rows where the mean age column has a value of greater than 30:
Table of interest by age. Rows with a mean of greater than 30 are hidden
See also


