Weighting
Weighting is another term for sample balancing. During a survey, it is not possible to interview everyone, so only a sample of the population is interviewed. If this sample group does not accurately reflect the proportions of various groups in the total population, you can then weight the survey results.
For example, of the 602 respondents interviewed in the Museum survey, 56.31% were male and 43.69% were female, which does not reflect the proportions of males and females in the general population. However, by using the genbalance weighting variable to weight the tables, you can inflate the responses from the female respondents and deflate the responses from the male respondents to reflect the actual balance of the genders.
How table weighting works
When UNICOM Intelligence Reporter - Survey Tabulation calculates counts in an unweighted table (or unweighted counts in a weighted table), it increments the count in each cell by 1 each time it finds a case that satisfies the conditions that define the cell. However, when UNICOM Intelligence Reporter - Survey Tabulation calculates counts in a table weighted with the genbalance weighting variable, it increments the counts in each cell as follows:
▪By 1.14; that is, (1 * 50/43.69) for female respondents
▪By 0.89; that is, (1 * 50/56.31) for male respondents
This assumes that the male/female proportions required are 50% of each.
The genbalance variable is a variable that stores the value 1.14 for every female and 0.89 for every male.
Weighting variables must be numeric variables. However, not all numeric variables are suitable for use as weights. Generally, weighting variables are created specially, typically using UNICOM Intelligence Professional.
Weighting hierarchical data
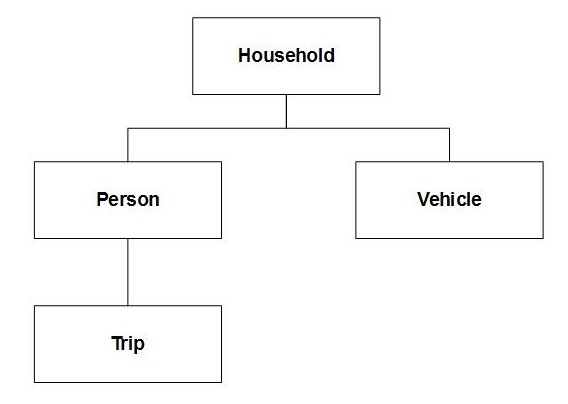
When you are using a hierarchical view of the data, the level of the weighting variable restricts the levels at which you can populate the table: you cannot populate a table at a level that is higher than the level of the weighting variable. To illustrate this, consider a survey similar to the Household sample that has following levels structure:
If the weighting variable is at the household (top) level, you can populate the table at the household, person, trip, or vehicle level (assuming the other variables on the table do not restrict the population level). However, if the weighting variable is at the person level, you cannot populate the table at the household level, because it is higher than the level of the weighting variable and you cannot populate the table at the vehicle level because it is at a parallel level to the weighting variable. However, you can populate the table at the trip level, because it is lower than the level of the weighting variable. See
Understanding population levels for more information.
Showing the unweighted base in weighted tables
When working with weighted data, it is good practice to show the unweighted base figures in addition to the weighted base figures. To facilitate this, by default, UNICOM Intelligence Reporter - Survey Tabulation automatically adds an unweighted base element at the start of each axis in a weighted table. See
The unweighted base in weighted tables for more information.
See also

