Server User Guides > Survey Tabulation > Statistical tests > T-test test > Statistical formula for the T-test test
 
Statistical formula for the T-test test
The following table shows the notation used in this topic.
In the formulae for axis-level test statistics, the formula is applied separately to the counts in each column or row, according to whether the axis containing the stat= option is the row or column axis.
Notation
Description
This graphic is described in the surrounding text.
The number of basic count elements in the axis or segment.
This graphic is described in the surrounding text.
The (weighted) count in the ith cell of a row or column representing that axis.
This graphic is described in the surrounding text.
The (weighted) base of the row or column.
This graphic is described in the surrounding text.
The unweighted base of the row or column.
Sum of factors
This graphic is described in the surrounding text.
Mean
This graphic is described in the surrounding text.
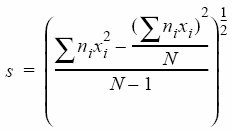
Standard deviation
This graphic is described in the surrounding text.
Standard error of mean
This graphic is described in the surrounding text.
One-sample and paired T-Test
This graphic is described in the surrounding text.
is tested against Student’s t-distribution with N - 1 degrees of freedom.
See also
Example of the T-test test
Details and restrictions of the T-test test
T-test test