Understanding charts
When you export tables to HTML, Microsoft Excel, and Microsoft Word, you can create charts. When you export tables to Microsoft PowerPoint, they are exported as charts by default. In addition, you can display charts in UNICOM Intelligence Reporter - Survey Tabulation.
Displaying charts in UNICOM Intelligence Reporter - Survey Tabulation requires a license for Microsoft Office Web Components (OWC). However, this is not necessary if you want to display only tables. For information on installing Microsoft Office Web Components and on how to enable charts in UNICOM Intelligence Reporter - Survey Tabulation, see the Installation Instructions.
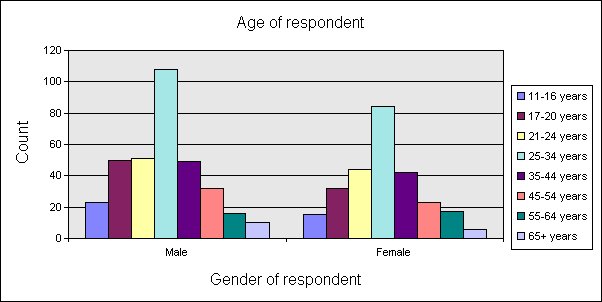
Here is a chart created from the table of Age by Gender shown in
Tables:
Chart of Age by Gender, with rows forming the chart series
See
See also

