Adding graphics
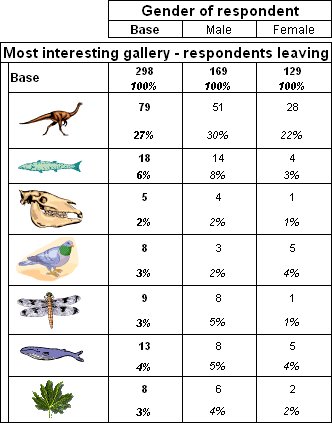
You can also use HTML formatting to add graphics to category row and column headings using the <img> tag. For example, you can display logos or pictures of products in addition to (or instead of) the category descriptions. Here is a table that illustrates this.
Table with graphics in category descriptions
The table has the interest variable on the side of the table. The descriptions of seven of the categories in the interest variable have been changed to images as shown in the following table. The other categories have been deleted.
Category name | Description (label) |
|---|
Dinosaurs | <img src="C:\Images\Dinosaur.png" alt="Dinosaurs"/> |
Fish_and_reptiles | <img src="C:\Images\Fish.png" alt="Fish and reptiles"/> |
Fossils | <img src="C:\Images\Fossil.png" alt="Fossils"/> |
Birds | <img src="C:\Images\Bird.png" alt="Birds"/> |
Insects | <img src="C:\Images\Insects.png" alt="Insects"/> |
Whales | <img src="C:\Images\Whales.png" alt="Whales"/> |
Botany | <img src="C:\Images\Botany.png" alt="Botany"/> |
The alt attribute has been added so that the category description is displayed when someone moves the pointer over the pictures in the HTML output. For the images to display correctly in the HTML output, they must be in the specified locations on the output computer.
See also

