Cell contents
The default cell contents for tables are counts, which display the number of cases in each cell, and column percentages, which show the cell count’s percentage of the total for the column.
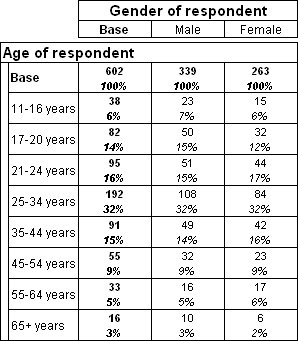
For example, if you open the Museum data set and create a table of age by gender using the default cell contents of counts and column percentages, the table looks like this:
The count in the Male cell of the 25-34 row shows the number of men in the survey who are between ages 25 and 34. The column percentage shows the percentage of the male respondents who are between ages 25 and 34.
In addition to counts and column percentages, you can show row percentages, which display each cell count’s percentage of the total for the row. For example, if you changed the cell contents of the previous table to show row percentages instead of column percentages, the cells in the Male and Female columns would indicate the percentage of respondents in each age group who are male and the percentage who are female.
Another option is to show total percentages, which display what percentage of all of the respondents in the table are in each cell. If you are interested only in the counts, you can choose not to display any other type of cell content, and if you are interested only in percentages, you can choose not to show the counts at all.
You can also show summary statistics of numeric variables in the table cells. For example, the visits variable records how many times each respondent has previously visited the museum. Using this variable, you can change the table of age by gender to show the total number of previous visits made by the respondents in each cell.
You can also choose not to display rows or columns for which the values are below a certain value. For more information, see
Suppressing rows and columns .
See also

