Displaying totals and subtotals
This example is based on the Museum sample data set.
age{.. E2534_years, youngpeople 'Younger people' subtotal(),
E3544_years.., maturepeople 'Older people' subtotal(),
total()}
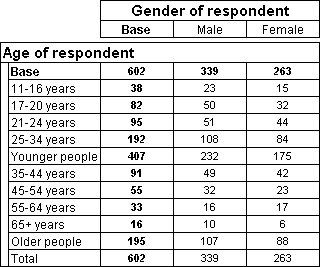
This creates an axis based on the age variable, with the addition of two subtotal elements and a total element. The range syntax specifies the categories that are to appear before the first subtotal. These are the categories that will contribute to the subtotal. A subtotal element provides a subtotal of the counts in the categories that precede it in the axis up to the last base, subtotal, or total element. So the second subtotal sums the categories that appear between the first and second subtotal. The total element provides a total of the counts in the categories that precede it up to the most recent base or total element.
The subtotal elements have each been given a name. This is necessary when you create two special elements of the same type in an axis, because otherwise the default names are used and this will lead to a duplicate name error.
Table showing total and subtotal elements
Here is a table that has this axis on the side:
See also

