Tabulation
Tabulation guidelines
The performance improvements in the tabulation components is focused on optimizing the population of large table sets for tracking studies. The following list of the performance enhancements were made:
▪Global Filter optimization (released with UNICOM Intelligence 5.6 Patch 2). Global filters are often applied to large tracking studies when tables are produced for a specific wave or reporting period. When a subset of the data set is tabulated, the population times are now proportionally faster than tabulating the entire data set.
▪Aggregate tables at the same level in a single data pass (released with UNICOM Intelligence 5.6 Patch 2). Tables can be aggregated in a single data pass if they are at the same level. However, although users can create tables in any order, the Tables Object Model (TOM) internally resorts tables to group them at the same level and share a single data pass.
▪Reduce derived variable creation (released with UNICOM Intelligence 5.6 Patch 2). When aggregating tables with axis expressions TOM must create derived variables based on the axis expression. By identifying whether different axis can share the same derived variable, TOM minimizes the creation of the derived variables and thus reduces memory usage in MDM and the time that is required to populate the tables.
▪Optimize expression evaluation in derived variables (released with UNICOM Intelligence 5.6 Patch 2). Instead of using the Intersection operator to evaluate nets and combines, the ‘has intersection’ (=*) operator was introduced to improve derived variable performance. The ‘has intersection’ operator returns true if two category sets share at least one category. By returning true or false instead of a new category set, memory allocation is reduced.
▪Continue aggregation on error (released with UNICOM Intelligence 6). The failure to populate one table no longer impacts the population of the entire table set. The population error is clearly indicated in the table results, which avoids the need to correct all errors before table results can be viewed.
▪Optimize aggregation request (released with UNICOM Intelligence 6). When numerous tables are populated (over 800), optimizations made to the aggregation request result in up to a 30% reduction in total population time.
▪Aggregation improves with multiple CPUs when using the Intelligence Data File or IBM SPSS Statistics File DSCs (released with UNICOM Intelligence 7.5).
▪The EvaluateGridSummary function (released with UNICOM Intelligence 7.5) simplifies the creation of variables that show the number of respondents that chose a specified response for a grid iteration; for example, a Top 2 variable that shows the number of respondents who gave a positive answer for each iteration of a grid.
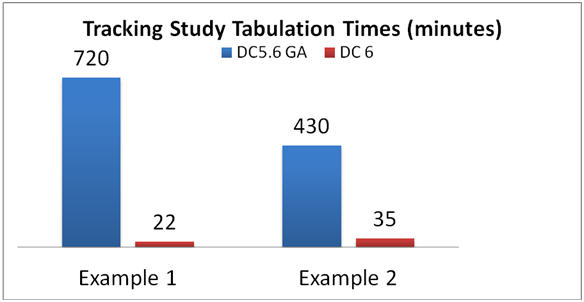
For two key customer tracking study examples, the overall tabulation time was reduced by more than 90%. The impact of these performance improvements vary depending on the data set, filters, and the number of populated tables.
▪Multiple aggregation components running in parallel can use separate connections to the underlying data file, thereby giving better performance when using multiple CPUs for Reporter or tables scripting.
The following sections provide general scripting guidelines for simplifying tabulation tasks and improving performance.
Use @ to avoid issues with VDATA versus HDATA expressions
Include an @ character in the declaration when you refer to questions that use defined lists. In the following example, the @ character was added to a category expression in the Rating defined list. When the defined list is used, the @ character refers to the variable in which the list is used, which allows the expression to be resolved correctly:
Rating "" define
{
Top2 "Top 2" elementtype(AnalysisCategory)
expression("@ * {Excellent, VeryGood}"),
Excellent "Excellent",
VeryGood "Very Good",
Good "Good",
Fair "Fair",
Poor "Poor"
};
Similarly, the same technique can be used to avoid loop issues, where different expressions are required for VDATA and HDATA. For example, for the Rating grid in the UNICOM Intelligence Developer Documentation Library Museum sample, a top 2 element is added as follows:
rating "Galleries planned to visit" loop
{
Dinosaurs "Dinosaurs",
Conservation "Conservation",
Fish_and_reptiles "Fish and reptiles",
Fossils "Fossils",
Birds "Birds",
Insects "Insects",
Whales "Whales",
Mammals "Mammals",
Minerals "Minerals",
Ecology "Ecology",
Botany "Botany",
Origin_of_species "Origin of species",
Human_biology "Human biology",
Evolution "Evolution",
Wildlife_in_danger "Wildlife in danger"
} fields
(
"Column" "Interest rating for galleries - respondents entering"
categorical [0..5]
{
Top2 "Top 2" elementtype(AnalysisCategory)
expression("@ * {Slightly_interested_4, Very_interested_5}"),
Very_interested_5 "Very interested (5)",
Slightly_interested_4 "Slightly interested (4)",
No_opinion_3 "No opinion (3)",
Not_particularly_interested_2 "Not particularly interested (2)",
Not_at_all_interested_1 "Not at all interested (1)"
};
) expand grid;
If the @ character is not used, different expressions need to be defined for the VDATA and HDATA.
For HDATA:
Top2 "Top 2" elementtype (AnalysisCategory) expression
( "Column * {Slightly_interested_4, Very_interested_5}" ),
For VDATA, a different expression must be defined for each slice. For example:
Top2 "Top 2" elementtype (AnalysisCategory) expression
( "Column * {Slightly_interested_4, Very_interested_5}" ),
Use native WHERE clause support withIDataSet.Filter
As described in
Data Source Components (DSCs), evaluating native
WHERE clauses in the CDSC can significantly improve performance when a subset of the data is read. The
IDataSet.Filter property supports native
WHERE clauses in tabulation.
Note An error is returned when the currently selected CDSC does not natively support the specified expression. For example:
TOM.DataSet.Filter = "Respondent.Serial < 1000"
Use the EvaluateGridSummary function for grid summaries
A common scenario is to create a multiple-response summary variable for grids. The EvaluateGridSummary function can be used to create multiple-response summary variables. Using the Rating grid from the Museum sample as an example:
rating "Galleries visited" loop
{
Dinosaurs "Dinosaurs",
Conservation "Conservation",
Fish_and_reptiles "Fish and reptiles",
Fossils "Fossils",
Birds "Birds",
Insects "Insects",
Whales "Whales",
Mammals "Mammals",
Minerals "Minerals",
Ecology "Ecology",
Botany "Botany",
Origin_of_species "Origin of species",
Human_biology "Human biology",
Evolution "Evolution",
Wildlife_in_danger "Wildlife in danger",
"Other" "Other"
} fields
(
"Column" "Interest rating for galleries - respondents leaving"
categorical [0..5]
{
Not_at_all_interested_1 "Not at all interested (1)" factor(1),
Not_particularly_interested_2 "Not particularly interested (2)" factor(2),
No_opinion_3 "No opinion (3)" factor(3),
Slightly_interested_4 "Slightly interested (4)" factor(4),
Very_interested_5 "Very interested (5)" factor(5)
};
A variable can be defined to summarize which galleries are top 2 interested (Very interested and slightly interested):
GalleriesTop2 "Interested in Gallery (Top 2)"
categorical [1..]
{
Base "Base" elementtype(AnalysisBase) expression("GalleriesTop2 > {}"),
Dinosaurs "Dinosaurs",
Conservation "Conservation",
Fish_and_reptiles "Fish and reptiles",
Fossils "Fossils",
Birds "Birds",
Insects "Insects",
Whales "Whales",
Mammals "Mammals",
Minerals "Minerals",
Ecology "Ecology",
Botany "Botany",
Origin_of_species "Origin of species",
Human_biology "Human biology",
Evolution "Evolution",
Wildlife_in_danger "Wildlife in danger",
"Other" "Other"
} expression("SUM(rating.(EvaluateGridSummary(Column, {Very_interested_5, Slightly_interested_4}, LevelID, False)))", NoDeriveElements);
Use Rot with derived elements when adding external data
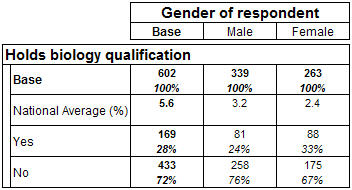
A derived element, that uses the Rot function, can be added when external data is added (such as normative values to a table). For example:
TableDoc.Tables.AddNew("T2", "biology{base(), eDerived 'National Average - %'
derived('CLong(Rot({0,0,0,56,32,24}, 1)) / 10.0') [Decimals=1, CountsOnly=True], Yes, No} * gender")
Notes
▪The Rot() function always skips over the first values it is provided. To work around this issue, the function must always be provided an initial value of 0.
▪Hidden rows and summary rows are ignored during value allocation.
Evaluate single expressions at the variable level
When you create new variables, evaluate single expressions at the variable level instead of evaluating expressions for each derived element. The following functions can be used to evaluate single expressions:
▪- converts the value of a numeric, text, or date value to a categorical value according to the definition of the specified categorical variable. As an example, when text variable contains city names, the names can be categorized by defining an expression for each element:
Beijing "Beijing" expression("City = ""Beijing""")
Unfortunately, this method requires an expression to be defined and evaluated for each category. A more efficient way to define the variable is to use the Categorize function. For example:
City "Which city are you living"
text
helperfields (
"Codes" "Which city are you living"
categorical [0..1]
{
Beijing "Beijing",
Shanghai "Shanghai",
Guangzhou "Guangzhou",
London "London",
Chicago "Chicago",
- "Other" other("Other" "Other" text )
} expression("Categorize(City,""City.Codes"")",
NoDeriveElements) usagetype("HelperField");
);
▪- provides the same functions as an IF-THEN-ELSE statement. The Decode function is similar to IIf. For example:
Citycode "The code to cities"
long [1..3];
City "The Name of the cities"
Categorical [1..1]
{
Beijing "Beijing",
Shanghai "Shanghai",
Chengdu "Chengdu",
London "London",
Paris "Paris"
}expression ("Decode(CityCode,
101, {Beijing},
102, {Shanghai},
103, {Chengdu},
104, {London},
105, {Paris},
{})", NoDeriveElements);
Overlapping for grid, column means, and proportions
Overlapping data occurs when a field is either a multiple response categorical or a grid. (normal overlap and grid overlap). When data overlaps, it means that the two data samples are not considered independent.
Each axis in a UNICOM Intelligence Reporter table can be derived from either an axis expression or a Meta Data Model (MDM) variable. Three rules dictate whether a user can manually turn on/off the overlap formula.
1 Table Object Model (TOM) recognizes the MaxResponses property when an axis is derived from an axis expression. TOM regards the axis as overlapped when the MaxResponses value is greater than or equal to 2. Considering that the MaxResponses default value is 2, each axis is in an overlap state by default. To change the MaxResponses property:
Change the Maximum number of Responses setting in the UNICOM Intelligence Reporter user interface: Edit > Edit Variable > Categories > Maximum number of Responses.
Update the MDM variable definition. For example:
Gender "Gender"
[
IsUserDefined = true,
DeleteMe = true
]
Categorical [..1]{
Male "Male"
[
Value = 1
],
Female "Female"
[
Value = 2
]
} expression("Q41", NoDeriveElements);
2 TOM recognizes the variable's EffectiveMaxValue property when an axis is derived from an MDM variable. TOM regards the axis as overlapped when the EffectiveMaxValue value is greater or equal to 2. TOM regards the side or top as overlapped when any subaxis is overlapped for a table's side and top.
3 Set the UseGridOverlapFormula property when the statistics must use the grid overlap formula. The grid overlap formula is not used when UseGridOverlapFormula is set to false. The normal overlap formula is used when the current table is an overlap table (normal overlap or grid table). The product decides which formula to use when the property is set to true.
The grid overlap formula is applied to the table when both the side and top are overlapped and UseGridOverlapFormula is true. The normal overlap formula is applied when the table's top axes are overlapped; otherwise, the standard formula is used.
Note By default, UseGridOverlapFormula is set to true. Users should not use the property to turn off the overlap formula if they do not understand the statistical formula.
Performance considerations
The grid overlap formula typically requires more memory and more execution time than the normal overlap formula.
▪Table matrix size
TOM automatically adds a base element, and the table aggregator component adds an extra Squared weight element. When a table is defined as VarA * VarB2, the matrix size is:
Matrix_Size = (X+2) * (Y+2)
When the table is grid overlap, the matrix size is:
Matrix_Size = X *((Y*(Y-1)*X)/2 + X)
If Matrix_Size % Y <> 0 Then
Matrix_Size = Matrix_Size + Y – (Matrix_Size %Y)
End If
2VarA has X categories; VarB hasY categories.
▪Case study of turning off grid overlap when it is not required
Take the following table script as an example:
' Define the tables
Set Table = TableDoc.Tables.AddNew("Table67", "Q15 * Overall + Gender + Buyer + GendersCarried + Market + Assisted + AwareofBrands + Planned + FittingRoomUsers + FreqofBrand + BrandFamiliarity + Tourist + OpenAir + Income + Age + StoreType + Ethnicity", " Q15: ")
Set Statistic = Table.Statistics.Add("ColumnProportions")
SetProperty(Statistic.Properties, "SigLevel", 5)
' Populate the tables
TableDoc.Populate()
The Q15 variable definition is:
Q15 "What other apparel brands have you shopped in the past two years? [MA ¨C DO NOT READ]"
[
IsUserDefined = true
]
categorical
{
Yes "Yes"
[
Value = 1
],
No "No"
[
Value = 2
]
} expression("Q15_Other__write_in", NoDeriveElements)
axis("{base(),eExpression '7 for all men kind'
expression('Q15_r7_for_all_men_kind.ContainsAny({Yes})'),... ");
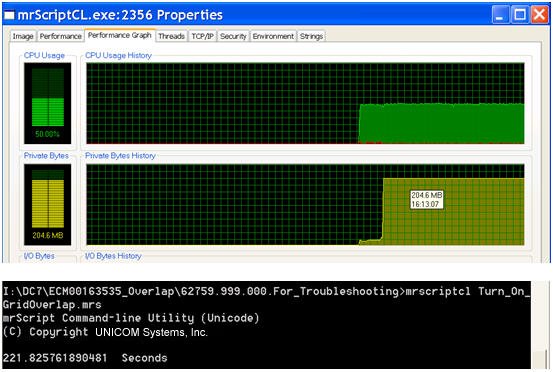
The table aggregator component uses the grid overlap formula to tabulate the report when both the side and top axis include a multiple response variable. The following image shows the memory and execution time profile:
Setting MaxResponse to 1 effectively breaks the grid overlap rules because Yes and No are exclusive answers.
Q15 "What other apparel brands have you shopped in the past two years? [MA ¨C DO NOT READ]"
[
IsUserDefined = true
]
Categorical [..1]
{
Yes "Yes"
[
Value = 1
],
No "No"
[
Value = 2
]
} expression("Q15_Other__write_in", NoDeriveElements)
axis("{base(),eExpression '7 for all men kind'
expression('Q15_r7_for_all_men_kind.ContainsAny({Yes})'),... ");
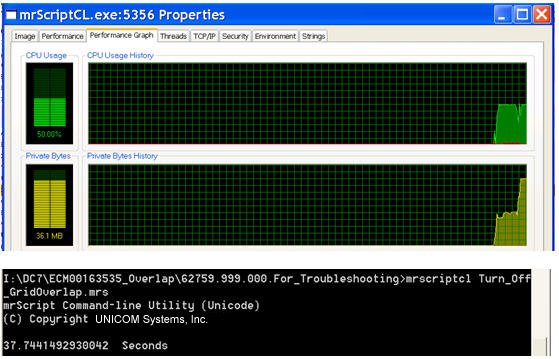
The following image shows the memory and execution time profile:
When the two profile results are compared, it is evident that there is significant memory and execution time savings when grid overlap is turned off (when necessary).
See


