Distributing records from one element across the axis
Quick reference
To define an element whose counts are to be distributed among the other elements in the axis, type:
ndi[;element_text] [;condition] [;options]
condition
A standard condition defining the respondents who are to be distributed across the other elements in the axis
options
Any of the options accepted on n statements.
More information
Quantum allows you distribute records belonging in one chosen element between the other elements in the axis. One example might be a No Answer element in a brand list axis, where those respondents who gave no answer are distributed amongst the brand elements of the axis.
ndi elements are normally suppressed when the axis is used as the rows or columns of a table, and are always ignored when the axis is a higher dimension. Use the options row and/or col to override this suppression with row and/or column axes.
Records belonging in an ndi element are distributed proportionally across all totalizable elements between the most recent base or ndi statement, whichever is the latest, and the ndi statement being processed. All totalizable elements are eligible to receive distributed values regardless of whether or not they are printed. (Totalizable elements are elements such as n01 and its equivalents which can be added up to form a total. Statistical and base elements are not totalizable because they are excluded from totals). If you want to prevent an element from receiving distributed values, include the keyword ntot in its definition. This flags it as a non-totalizable element which Quantum ignores for distribution purposes.
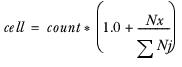
The formula used in the distribution process is:
count
The number of cases in the current cell.
Nx
is the number of cases in the ndi element.
The sum of cases in the totalizable elements.
Note The formula uses the sum of the values in the totalizable elements and not the base because some records might be present in the base but not in any other elements of the axis and some of the elements might be multicoded.
Compare the two tables below. The first is a standard table with no ndi element; the second is a variation of this in which the No Answer element has been defined with an ndi statement instead of an n01. The 5 respondents in this element have been distributed proportionally amongst the other elements according to the number of records in those elements. Hence, the increase from 15 to 16 male respondents for Brand A is the result of the calculation (15*(1+5/95)).
| Base | Male | Female |
Base | 100 | 46 | 54 |
Brand A | 31 | 15 | 16 |
Brand B | 35 | 17 | 18 |
Brand C | 19 | 9 | 10 |
Brand D | 10 | 3 | 7 |
No Answer | 5 | 2 | 3 |
| Base | Male | Female |
Base | 100 | 46 | 54 |
Brand A | 33 | 16 | 17 |
Brand B | 37 | 18 | 19 |
Brand C | 20 | 9 | 11 |
Brand D | 10 | 3 | 7 |
In this example, the base is the sum of the totalizable elements, but this is not always the case.
The specifications which created these two tables are as follows:
tab brdna sex
tab brand sex
l sex
col 110;Base;Male;Female
l brdna
col 156;Base;Brand A;Brand B;Brand C;Brand D;No Answer=' '
l brand
col 156;Base;Brand A;Brand B;Brand C;Brand D
ndi;c=c156' '
See also