Formulae
The formulae for the statistical tests described in this section are shown below.
When you ask for special T statistics, Quantum compares the T statistic that is calculated from your data with a formula that calculates the critical values of a T distribution. If the number calculated from the data is greater than the number derived from the formula, this is significant and you should expect to see a T statistic letter on your table. (The number is treated as significant if greater, regardless of whether it is positive or negative.) If you have asked Quantum to print the intermediate figures used in the calculation of the statistics, you will see that the last two figures shown per test are the significance value from the formula, and the T statistic which is derived from the data.
General notation
Symbol | Description |
|---|
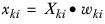
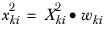
Xki | The value of the ith case in column k. |
wki | The weight for the ith case in column k. |
nk | The number of cases in column k. |
wk | The sum of the weights of the cases in column k; that is |
rk | The value of the cell count in the row being tested in column k. |
pk | The proportion of wk in the cell; that is |
| The population proportion from which sample k is drawn. |
| The mean of the population from which sample k is drawn. |
| The variance of the population from which sample k is drawn. |
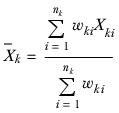
| The mean of sample k. |
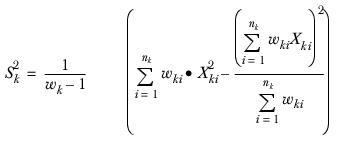
| The variance of sample k. |
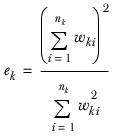
ek | The effective base in column k. It is calculated as |
no | The number of cases in overlap; that is the number of cases in both columns being tested. |
eo | The effective base of the cases in overlap. It is calculated as |
wo | The sum of the weights of the overlapping cases. |
Xoi | The value of the ith overlapping case. |
woi | The weight of the ith overlapping case. |
T-test on column means
This test compares the values of the means in two columns of a table. For each of the two columns (k=1, 2) you are testing the hypothesis that the population means are the same; that is μ1−μ2=0.
The sample means are calculated as
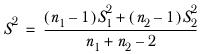
The sample variance is calculated as
It is assumed that each sample is drawn from the same population, so

.
You can therefore represent the population variance from which each sample is drawn as

.
As you do not know the value of

you use
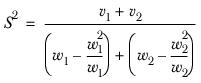
S2, a pooled estimate of

, where
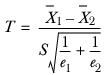
In the case of unweighted data, this reduces to
In the case of no overlap and if

, the variable
is distributed
t with

degrees of freedom.
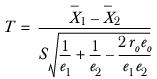
In the case of overlap, the T statistic must be adjusted and so
and is distributed
t with

degrees of freedom.
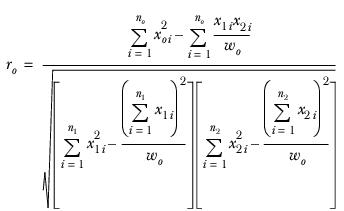
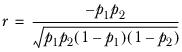
where ro is the correlation coefficient, defined as
where
This formula reduces to 1 for all cases except for overlapping grid tables.
For a more on the theory of overlapping samples, see Kish, Survey Sampling.
T-test on column proportions
This test compares the values of the proportions in two columns of a table. For each of the two columns (
k=1, 2) you are testing the hypothesis that the population proportions are the same; that is

, where the sample proportions are

and

, defined as
It is assumed that the samples are drawn from a common population, so estimate the population proportion variance,

, using the formula:
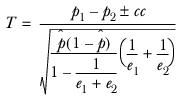
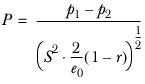
The variable T is calculated as
and is distributed
t with

degrees of freedom.
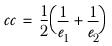
where
cc is the continuity correction, defined as
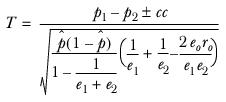
In the case of overlap, the T statistic must be adjusted for the covariance term and becomes
and is distributed
t with

degrees of freedom.
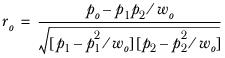
where ro is the correlation coefficient, defined as
For more on the theory of overlapping samples, see Kish, Survey Sampling.
Significant net difference test
For any row, and any set of four columns (k=1,2,3, and 4) let
▪The sum of weights (wk),
▪The sum of squared weights

,
▪The effective base (ek) and
▪The proportions

be as previously described.
Let

represent the column proportion in the overlap between columns
k and
j, and
ekj represent the effective base in the overlap.
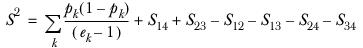
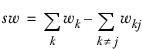
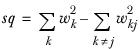
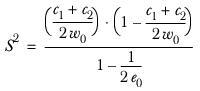
The estimated population variance S2 is calculated as
where
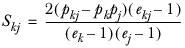
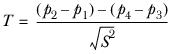
tthen
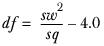
and is approximately distributed according to the t distribution with df degrees of freedom calculated as
where:
For a more on the theory of overlapping samples, see Kish, Survey Sampling.
Paired preference test
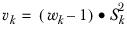
For any column and any pair of paired preference rows, let:
▪w0 be the weighted base for the column
▪w20 be the sum of squared weights for that column
▪ | eo = | w02
_____
w20 | be the effective base for that column |
For rows 1 and 2 in this column,
▪Pj is the proportion in the jth row
▪cj is the absolute value (as created by op=1) in row j
Let the correlation co-efficient between the two rows be:
Let:
Then:
Least significant difference test
For independent (non-overlapping) samples
For any set of columns defined with an elms= keyword, let:
df | be the degrees of freedom, calculated as: |
| df = N - ncols |
| where N is the number of observations in all means, and ncols is the number of columns in the set. |
t(df) | be the critical value of t at df degrees of freedom at some confidence level defined by the user. |
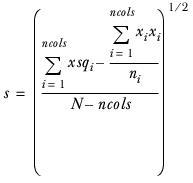
s | be the square root of the mean square within the columns defined with elms=: |
| |
| where: | |
| xsqi | is the sum over all observations in column i of the ‘squares of x’. |
| xi | is the sum of the values over all observations in column i. |
| ni | is the number of observations in column i. |
| N | is the sum over all observations in column i of ni (that is, the total number of observations in the elms= set of columns). |
| h | is the harmonic mean of the number of observations in each group, calculated as: |
| | |
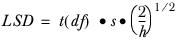
Then, the Least Significant Difference is calculated as:
For overlapping samples
The significance is tested using the normal tstat method. The LSD is then computed as follows:
For each pair of columns defined with an elms= keyword, let:
df | be the degrees of freedom, calculated by subtracting 1 from the number of observations in the first column. |
t(df) | be the critical value of t at df degrees of freedom at some confidence level defined by the user. |
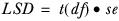
se | be the standard error of mean difference calculated as in the standard tstat computation ( T-test on column means). |
Then, the Least Significant Difference is calculated as:
Newman-Keuls T statistic
Quantum performs the following steps:
▪calculates the formula for each pair of columns
▪calculates the sum of these formulae for each column
▪sorts the columns in ascending order of the sum of the formulae
▪compares the significance of each pair of columns with the appropriate value in a lookup table.
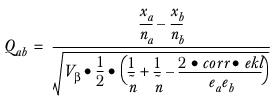
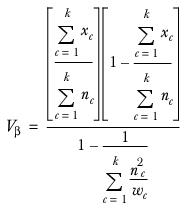
The formula for two columns a and b, is:
where:
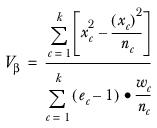
For the test of means:
where
k represents the number of columns tested.

represents the number of observations contributing to column
c.

represents the sum of squared weights for the observations contributing to column
c.

represents the sum of values in column
c, and is calculated as:

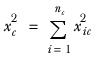
represents the sum of squared values in column
c, and is calculated as:

represents the effective base in column
c, and is calculated as:

represents the harmonic mean and is calculated as
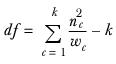
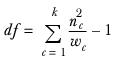
df represents the degrees of freedom and is calculated as:
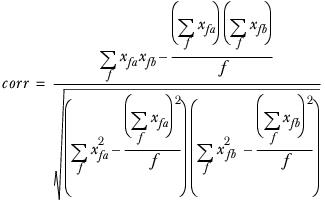
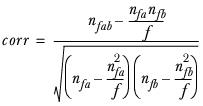
corr and ekl are the overlap corrections and are calculated as:
where f represents the number of observations in overlap contributing.
For the test of proportions:
where
k represents the number of columns tested.

represents the number of observations in the base of column
c.

represents the number of observations in the squared weights row in column
c.

represents the number in a row in column
c (that is, the count).

represents the effective base in column
c, and is calculated as:

represents the harmonic mean and is calculated as
df represents the degrees of freedom and is calculated as:
corr and ekl are the overlap corrections and are calculated as:
where f represents the number of observations in overlap in the base.
For a more on the theory of overlapping samples, see Kish, Survey Sampling.
References
Kish, L. Survey Sampling. New York: John Wiley and Sons. ISBN 0-471-48900-X.
See also