Formulae
The formulae for the statistics described in this section are given below.
The table below shows a typical rating axis with a number of statistical values. The factors assigned to each element are shown in parentheses after the element text. Notice that the NA/DK element has no factor so it is excluded from the statistical calculations.
The explanations of the formulae refer back to this table to illustrate how the figures were produced:
| Base | 18-24 | 25-34 | 35-44 | 45-54 |
Base | 22 | 8 | 5 | 4 | 5 |
Very satisfied (5) | 3 | 1 | 2 | 0 | 0 |
Satisfied (4) | 3 | 0 | 2 | 1 | 0 |
No opinion (3) | 6 | 2 | 0 | 3 | 1 |
Dissatisfied (2) | 4 | 2 | 0 | 0 | 2 |
Very dissatisfied (1) | 4 | 2 | 0 | 0 | 2 |
NA/DK | 2 | 1 | 1 | 0 | 0 |
Mean | 2.8 | 2.4 | 4.5 | 3.3 | 1.8 |
Standard deviation | 1.35 | 1.40 | 0.58 | 0.50 | 0.84 |
Standard error | 0.30 | 0.53 | 0.29 | 0.25 | 0.37 |
Sample variance | 0.09 | 0.28 | 0.08 | 0.06 | 0.14 |
In the formulae:
n i
The number of respondents in row i of the column
x i
The factor or increment associated with the ith cell
N
The total number of respondents in each element included in the calculation, that is:
A dot suffix indicates summation over the replaced index; so, for example, the formula for a column total is:
Sum of factors
Taking the column for respondents aged 18-24 in the sample table, the sum of factors is calculated as follows:
(1´5) + (0´4) + (2´3) + (2´2) + (2´1) = 17
Mean
Taking the column for respondents aged 18-24 in the sample table, the mean is calculated as follows. The sum of factors is 17 as described above, and the number of respondents included in the sum of factors is:
1 + 0 + 2 + 2 + 2 = 7
so the mean is 17/7 = 2.4.
Viewed in relation to the element texts, this tells you that the mean rating given by 18-24 year‑olds is between Dissatisfied and No opinion.
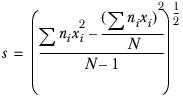
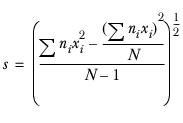
Standard deviation
The standard deviation tells you the amount by which you would expect respondents’ answers to differ from the mean. For 18-24 year-olds this is:
You would expect 67% of answer to lie within mean±std.dev; that is with in the range 2.4±1.4 (between 1.00 and 3.80).
Standard error of the mean
The default formula for the standard error is:
The standard error for the column 18-24 in the sample table is:
You can be 95% certain that the mean score for the population as a whole will lie in the range mean±2std.err. In this example the population means should lie within the range 2.4±2×0.53; that is, somewhere between 1.34 and 3.46.
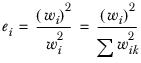
The variation of the formula used when the run contains the useeffbase keyword is as follows.
Let the sum of the squared weights, as calculated by the nsw statement, be:
where k moves through all respondents in the axis.
Then, the effective base for a column is:
The standard error is then:
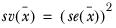
Sample variance of the mean
The sample variance for the 18-24 column is:
See also