Formulae
The formulae for the statistical tests in this section use the following conventions:
▪In the formulae for axis-level test statistics, the formula is applied separately to the counts in each column or row, according to whether the axis containing the stat= option is the row or column axis:
k | Represents the number of basic count elements in the axis or segment. |
ni | Represents the (weighted) count in the ith cell of a row or column representing that axis. |
N | Represents the (weighted) base of that row or column. |
U | Represents the unweighted base of that row or column. |
▪In the formulae for table-level test statistics:
r | Represents the number of basic count rows from which the statistic is calculated. |
c | Represents the number of basic count columns from which the statistic is calculated. |
nij | Represents the (weighted) count in row i, column j. |
N, Ni, Nj | Represent the (weighted) bases of the table overall, column i and row j respectively. |
▪A dot suffix indicates summation over the replaced index; so, for example, the formula for a column total is:
▪The sum of factors, mean, standard deviation, standard error and sample variance of a row or column are calculated in exactly the same way as by the n13, n12, n17, n19 and n20 statements.
The sum of factors is given by:
The mean is given by:

g
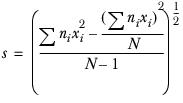
The standard deviation is given by:
The standard error of the mean is given by:
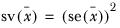
The sample variance of the mean is given by:
In all cases, xi represents the factor or increment associated with the ith cell.
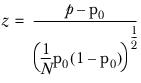
One-sample Z-test on proportions
where:
and p0 is the value specified in the fac= option, converted to a proportion.
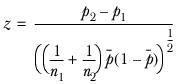
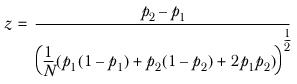
Two-sample Z-test on proportions
For each pair of columns:
where:
and:
Z-test on sub-sample proportions
For each pair of columns:
where:
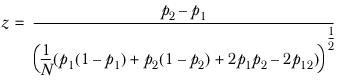
Z-test on overlapping samples
For each pair of columns:
where:
and:
One-sample and paired T-test
is tested against Student’s t-distribution with N - 1 degrees of freedom.
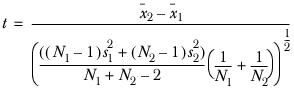
Two-sample T-test
For each pair of columns:
is tested against Student’s t-distribution with N1 + N2 - 2 degrees of freedom.
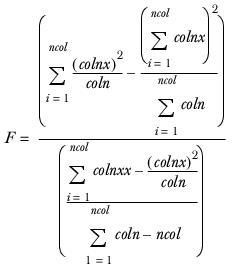
F and T values from an nft statement
The formula for the F value of a group is as follows.
Let:
▪ncol be the number of columns in the group
▪coln be the number of cases in column n
▪colnx be the sum over all cases in column n of the fac= or inc= values
▪colnxx be the sum over all cases in column n of the squared fac= or inc= values.
Then:
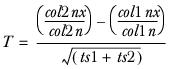
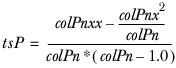
The formula for the T value for a pair of columns is as follows.
Let colPnxx, colPnx and colPn be the same as colnxx, colnx and coln, defined above, for values P=1 and P=2.
Then:
where tsP is calculated for P=1 and P=2 as:
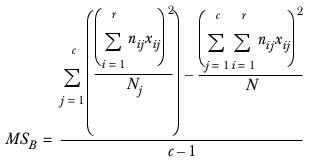
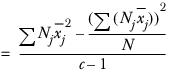
F-test / one-way analysis of variance
The between-sample estimate of variance is given by:
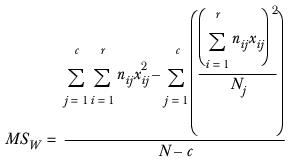
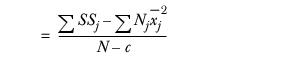
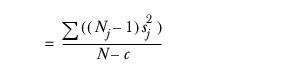
The within-sample estimate of variance is given by:
where:
is the sum of squares in column j.
Then the statistic:
is tested against Fisher’s F distribution with c - 1 and N - c degrees of freedom.
Newman-Keuls test
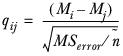
The formula for two columns, i and j, is:
where:
Mi | Represents the mean value in column i. |
Mj | Represents the mean value in column j. |
| Represents the harmonic mean of the group and is calculated as: |
Note The columns are sorted so that Mi is always greater than or equal to Mj.
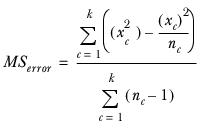
where:
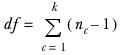
k | Represents the total number of columns in the test with a maximum of 20. |
nc | Represents the number of observations in column c. |
xc | Represents the sum of values in column c. |
| Represents the sum of the squared values in column c. |
df | Represents the degrees of freedom, calculated as: |
References
▪Miller, R. G. Simultaneous Statistical Inference. 2nd Edition. New York: Springer-Verlag. ISBN 0‑387-90548-0
▪Snedecor, G. W. and Cochran, W. G. Statistical Methods. 7th Edition, Ames, Iowa: The Iowa State University Press. ISBN‑8138‑1560‑6
▪Winer, B. J. Statistical Principles in Experimental Design. 3rd Edition. New York: McGraw-Hill. ISBN 0007070923
See also