You can improve Universal Cache performance, for example, by optimizing your system and network setup or introducing parallelism to your configuration setup.
The guidelines given in this chapter complement the tuning information specific to solidDB® (see solidDB® Administrator Guide) and your backend data server.
Optimizing system and network setup
▪The amount of memory allocated to each IBM InfoSphere CDC instance should be at least 256 MB.
The memory allocation for the IBM InfoSphere CDC instance is defined when creating the instance with the Configuration Tool (option Maximum Memory Allowed). The minimum allocation is 64 MB; the default is 512 MB for a 32 bit instance and 1024 MB for a 64 bit instance.
▪Available processor capacity
Processing data with IBM InfoSphere CDC is processor intensive; ensure that you have enough processor capacity available in all the nodes included in your Universal Cache setup.
▪Network latency and throughput
Optimizing your network for high throughput and low latency can improve Universal Cache performance.
Improving performance with parallelism
In a typical setup, the IBM InfoSphere CDC replication engine sets the following limitations to the performance:
▪At the source end, the performance is limited to about total of 15 000 operations per second for all the subscriptions together.
▪At the target end, the performance is limited to about 5000 operations per second per subscription.
The performance can be improved by using multiple subscriptions or multiple solidDB® frontends to partition the data and workload. This is because multiple subscriptions are processed in parallel at both the frontend and the backend.
For example, you can create separate subscriptions for autonomous tables that are not referencing or referenced outside the subscription. You can also place such tables/subscriptions in separate solidDB® frontends.
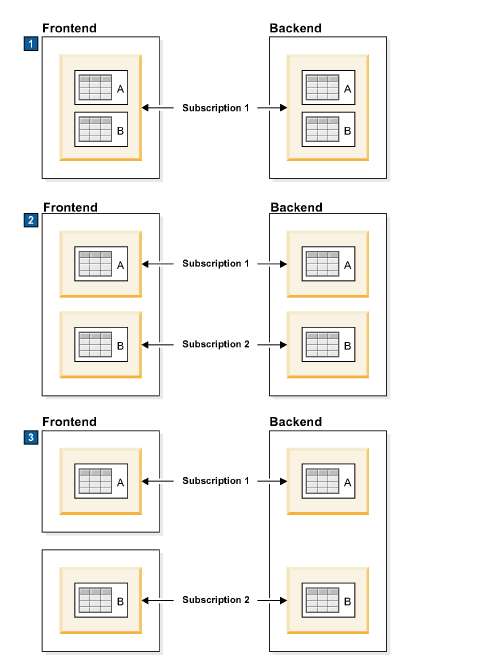
Universal Cache setup with three partitioning models
▪Single solidDB® front end with one subscription; no partitioning
▪Single solidDB® front end with two subscriptions; partitioning with two parallel subscriptions
▪Two solidDB® front ends with one subscription each; partitioning with two front ends
Optimizing log reading behavior
▪Throttling
If the replication cannot accommodate a sustained load in the solidDB® server, the processing is throttled down (slowed). From the application standpoint, that results in increased response times. The replication traffic is buffered so that load bursts can be accommodated. The size of the corresponding in-memory buffer is controlled with the configuration parameter LogReader.MaxSpace.
As of V7.0 Fix Pack 3, you can also disable throttling by setting the LogReader.UseThrottlingparameter to no.
▪Offline operation and log overflow
If the replication is stopped or has failed, the solidDB® server might continue to process the load, accumulating the data for a later transfer. The limit of the accumulated data is set with the LogReader.MaxLogSizeconfiguration parameter. When the amount of accumulated data exceeds the values of the LogReader.MaxLogSizeparameter, the log overflow occurs, resulting in a situation where replication catchup is no longer possible. If catchup is no longer possible, you need to refresh the subscriptions.
Other considerations
▪The target database must be capable of bearing the load generated by the IBM InfoSphere CDC replication engine.
▪Any processing of data may introduce bottlenecks, for example: