Often there is one symbol doing the main work on a process flow diagram.
1 Run a Statistics report against any symbol on the diagram by selecting it and choosing Reports > Statistics.
2 In the report that appears, click Chart. You can see how busy this particular process is in the overall flow, the percentage of time that it is free, and so forth.
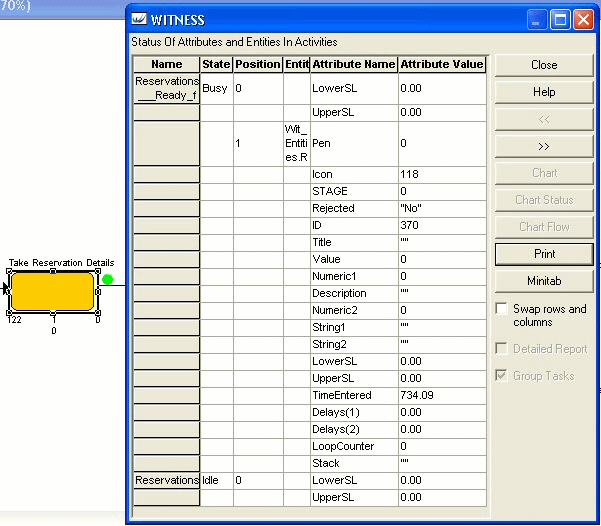
Exploding a symbol
1 Select the a process symbol on a diagram in SA/Viewer and choose Reports > Explode.
2 View the explosion statistical report that opens. It gives you statistics at an instant in time about the symbol chosen. For example, Lower SL = Service Levels that you are aiming for. Time entered is the time that the current token (Reservation) entered the process, in seconds.