The analytics applicable to the Landscape Application diagram operate in the same way that the Analytics function in System Architect; they enable users to run metrics reports on information in the repository and visually indicate results of such metrics on diagrams.
To execute an analytic
1 Open a diagram; in this example, an Application Landscape diagram.
2 Drag an analytic from the Explorer window.
Result
For example, the analytic “Services supported by apps on servers out of support before end 2010” looks at Services that are provided by Applications supported on Servers where the support end date for the Server is before the end of 31/12/2010. This analytic colors symbols that meet the criteria specified in the analytic.
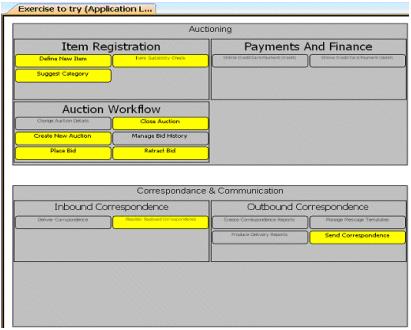
The following is an example of updated Application Landscape diagram after execution of an analytic.
Additional analytics are executed against the diagram in the same manner.